GOLD AND US DOLLAR PRICES AND CHARTS:
- Gold needs to hold $1,262/oz. level in the short-term.
- US Dollar Basket (DXY) sitting on important 200-day moving average.
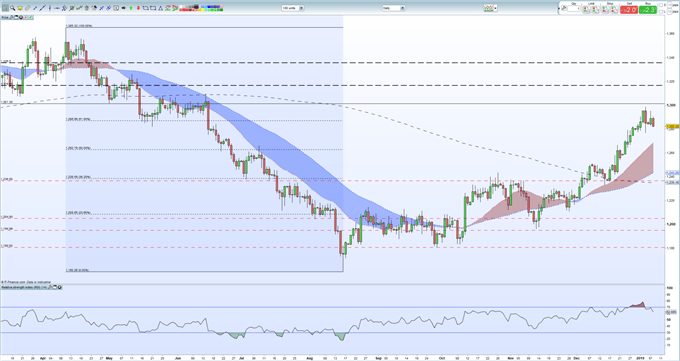
GOLD LIKELY TO DRIFT LOWER
The price of gold continues to nudge lower and is heading towards the 50% Fibonacci retracement of the April – August 2018 move around $1,262/oz. The precious metal has moved out of overbought territory, shown by the RSI indicator at the bottom of the chart, and remains supported above all three moving averages. Ahead of the Fibonacci support, the 20-day moving average at $1,268/oz. may hold sway. To the upside, $1,299/oz. (January 4 high) and $1,309/oz. (June 14, 2018 high).
GOLD DAILY PRICE CHART (MARCH 2018 – JANUARY 8, 2019)
Retail traders are 69.4% net-long gold, a bearish contrarian set-up. However recent daily and weekly positional shifts suggest that the spot gold price may soon move higher.
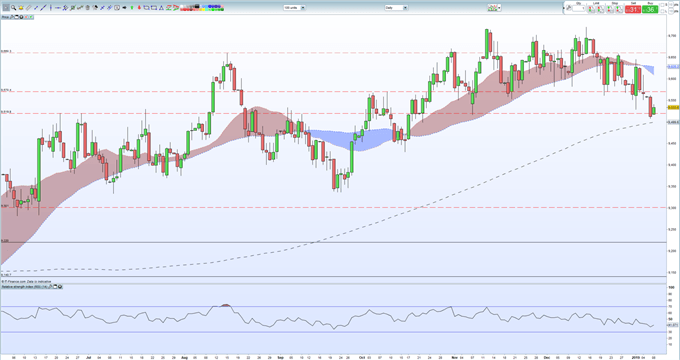
US DOLLAR BASKET (DXY) TEETERS
The US dollar basket (DXY) is currently being supported by the important 200-day moving average, although the short-term downtrend looks clear. DXY is currently quoted at 95.35, with the long-term moving average at 95.00. A sequence of lower highs and lows from December 14 paints a negative picture, while the greenback also trades both the 20- and 50-day moving average. A break lower opens horizontal support at 94.30, the October 16 swing-low.
US DOLLAR BASKET (DXY) DAILY PRICE CHART (JUNE 2018 – JANUARY 8, 2019)
No comments:
Post a Comment