fundamental analysis: January 2019

Wednesday, January 30, 2019

FOMC Preview: EUR/USD Outlook Hinges on Fed Balance-Sheet Reduction

TRADING THE NEWS: FEDERAL OPEN MARKET COMMITTEE (FOMC) INTEREST RATE DECISION

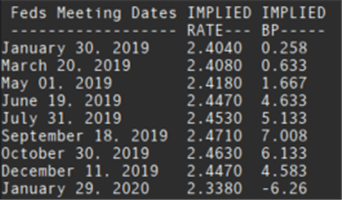
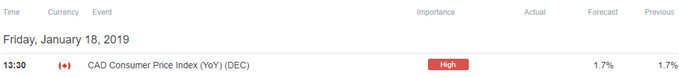
The Federal Reserve’s first interest rate decision for 2019 may generate a mixed reaction in the U.S. dollar as the central bank is expected to keep the benchmark interest rate in its current threshold of 2.25% to 2.50%.
Image of DailyFX economic calendar
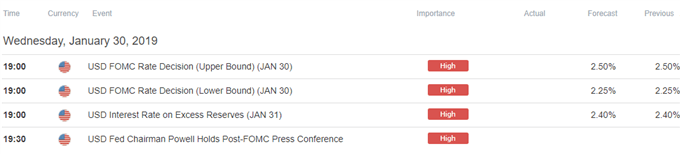
It seems as though the Federal Open Market Committee (FOMC) is gradually changing its tune after delivering four rate-hikes in 2018 as officials see ‘growth moderating ahead, and fresh comments from Chairman Jerome Powell & Co. may drag on the greenback should the central bank show a greater willingness to conclude the hiking-cycle ahead of schedule. In turn, a less-hawkish forward-guidance may generate a more pronounced rebound in EUR/USD as market participants scale back bets for an imminent rate-hike, but it remains to be seen if the FOMC will adjust the $50B/month in quantitative tightening (QT) amid little to no signs of a recession.
With that said, the U.S. dollar may face a more bullish fate as long as the FOMC indicates a further reduction in the balance sheet, and the central bank may continue to prepare U.S. households and business for a less-accommodative stance as ‘members generally judged that the economy had been evolving about as they had anticipated.’
IMPACT THAT THE FOMC RATE DECISION HAD ON EUR/USD DURING THE LAST MEETING
Period
Data Released
Estimate
Actual
Pips Change
(1 Hour post event )
Pips Change
(End of Day post event)
DEC
2018
12/19/2018 19:00:00 GMT
2.25% to 2.50%
2.25% to 2.50%
-52
-54
December 2018 Federal Open Market Committee (FOMC) Interest Rate Decision
EUR/USD 5-Minute Chart
Image of eurusd 5-minute chart
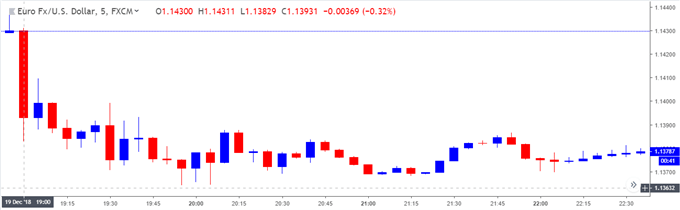
The Federal Open Market Committee (FOMC) delivered a 25bp rate-hike at its last meeting for 2018 to push the benchmark interest rate to a fresh threshold of 2.25% to 2.50%. The accompanying policy statement suggests the Fed will continue to pursue its hiking-cycle in 2019 as ‘the Committee judges that some further gradual increases in the target range for the federal funds rate will be consistent with sustained expansion of economic activity, strong labor market conditions, and inflation near the Committee's symmetric 2 percent objective over the medium term.
The U.S. dollar gained ground following the Fed rate-hike, with EUR/USD slipping below the 1.1400 handle to close the day at 1.1376. Review the 
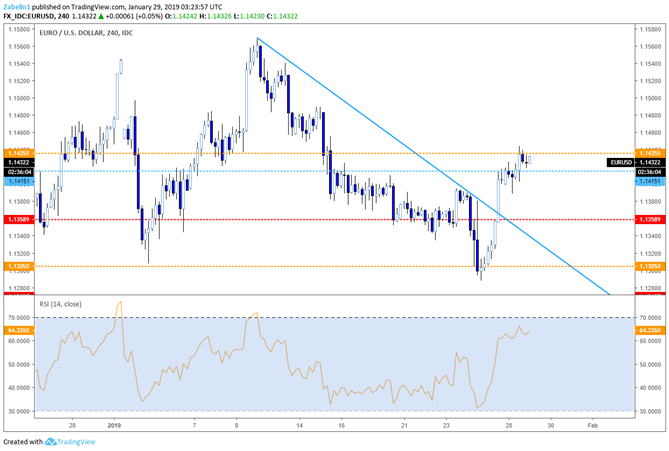
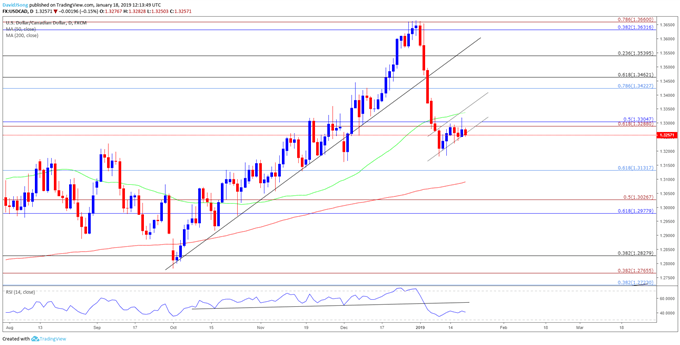
EUR/USD DAILY CHART
Image of eurusd daily chart
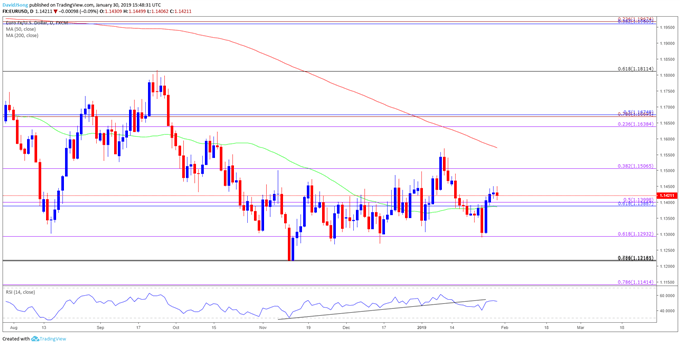
  • Keep in mind, the near-term outlook remains constructive as EUR/USD took out the November-high (1.1500), with the 1.1290 (61.8% expansion) offering near-term support.
  • Need a move back above the 1.1510 (38.2% expansion) hurdle to open up the Fibonacci overlap around 1.1640 (23.6% expansion) to 1.1680 (50% retracement), with the next region of interest coming in around 1.1810 (61.8% retracement), which largely lines up with the September-high (1.1815).

Gold Price Analysis: FOMC May Spark Short-Term Pullback

Gold Price Analysis and Talking Points:
  • Less Dovish Than Expected Fed May Dent Gold Upside
  • Technical Factors Suggest Near Term Pullback

LESS DOVISH THAN EXPECTED FED MAY DENT GOLD UPSIDE

Since the Federal Reserve’s U-Turn on monetary policy, in which rate setters have agreed to take a wait-and-see stance regarding interest rate rises. Gold prices have propelled higher, making a breach above $1300/oz for the first time since June 2018, with Fed Fund Futures pricing currently calling the end of the rate hiking cycle (Too dovish in our view). Alongside this, the deteriorating economic outlook and softening data has seen safe haven flows support the precious metal.
Gold Price Analysis: FOMC May Spark Short-Term Pullback

However, gold bulls expecting further upside in the short term could be left temporarily disappointed if the Fed is less dovish than what the markets expect. Given that rate guidance has been well telegraphed by Fed members, focus will predominantly center around the uncertainty that lies with the outlook of the Fed’s balance sheet. On Friday, gold saw its largest rise since October (rising 1.76%) after a report from WSJ that “Fed Officials are weighing an earlier than expected end to bond portfolio runoff”. As such, unless there are hints that this could be the case, gold could see a slight pullback. While we are bullish on the precious metal, we are somewhat cautious with this view in the short term.

TECHNICAL FACTORS SUGGEST NEAR TERM PULLBACK

Short term technical indicators are signaling that gold prices may see a slight pullback. The RSI on the daily-time frame confirms a negative divergence, which also lies within overbought territory. This also coincides with rising trendline resistance situated at $1318.
On the longer term, bulls will eye a topside breach of $1325/oz (May 2018 high), which increases the likelihood of a test of the $1360.
GOLD PRICE CHART: DAILY TIME-FRAME (MAR 2018-JAN 2019)
Gold Price Analysis: FOMC May Spark Short-Term Pullback

Tuesday, January 29, 2019

Crude Oil Prices May Focus on US, China Trade Talks for Direction

CRUDE OIL & GOLD TALKING POINTS:

  • Crude oil prices rise amid talk of further US sanctions on Venezuela
  • Gold prices shrug off US Dollar gains to rise as Treasury yields drop
  • US-China trade talks may overshadow FOMC rate decision, US GDP
A lull in top-tier relevant event risk and a deluge of incoming developments translated into uneven performance for benchmark commodities. Gold prices rose – shrugging off a modestly stronger US Dollar – as Treasury bond yields declined despite the absence of a clear lead from sentiment trends.
Crude oil prices jumped after US Treasury Secretary Steve Mnuchin said in an interview with Bloomberg that further sanctions on Venezuela are being considered. That appeared to amplify supply concerns touched off by political turmoil amid dueling claims on the country’s presidency.

FOMC AND US GDP DUE, US-CHINA TRADE TALKS MAY PROVE PIVOTAL

An action-packed session in the hours ahead features a first look at fourth-quarter US GDP data as well as an FOMC policy announcement and press conference with Chair Powell. Traders are also eyeing soundbites from the sidelines of US-China trade talks as Vice Premier Liu He visits Washington DC.
PMI survey data endorses the idea that growth slowed in the last three months of 2018 but outperformance relative to forecasts hints it may moderate less than economists envision. As for the Fed, it may cite the recent disruption in data flow courtesy of the US government shutdown to justify a status-quo stance.
If so, positive cues for market sentiment from a modestly upbeat GDP print might be offset as investors interpret the Fed’s reluctance to consider dialing back quantitative tightening (QT) as mildly hawkish. On balance, that leaves the trade talks as the tipping factor sentiment trends.
Mr Mnuchin also said he expects meetings with Chinese delegation to yield “significant progress”. That echoes hopeful comments from the Trump administration’s top economic adviser Larry Kudlow but clashes with remarks from Commerce Secretary Ross, who said the two countries are “miles and miles” apart.
For their part, investors will want to see concrete steps toward de-escalation. If what they see instead are vague pronouncements couched in empty niceties, a sense of disappointment might emerge. That would bode ill for risk-geared crude oil.
The outlook for gold appears to be rather more clouded. A risk-off scenario has scope to pressure yields lower but US Dollar gains encouraged by both the Fed and any renewed safety-seeking liquidity demand might derail upward follow-through.
GOLD TECHNICAL ANALYSIS
Gold prices pushed past resistance in the 1302.97-07.32, opening the door for a test of the chart inflection point at 1323.60 next. Moving further above that puts the pivotal double top in the 1357.50-66.06 zone back in focus. Alternatively, a turn back below rising trend support at 1283.32 sets the stage to revisit the 1260.80-63.76 region.
Gold price chart - daily

CRUDE OIL TECHNICAL ANALYSIS

Crude oil prices are struggling to find lasting momentum, but a bearish Evening Star candlestick pattern continues to suggest a top may be in the making. Breaking below support in the 49.41-50.15 area paves the way for a challenge of the 42.05-55 zone. Alternatively, move above resistance in the 54.51-55.24 region targets the chart inflection point at 59.05.
Crude oil price chart - daily

Monday, January 28, 2019

Will the Euro Fall on France Consumer Confidence? Riots in Sight

TALKING POINTS - YELLOW VESTS PROTESTS, CONSUMER CONFIDENCE, EURO

  • Euro may dip on French Consumer Confidence Report
  • Yellow Vest protests may be disrupting economic activity
  • Deeper EU-wide economic slowdown on the horizon?
EUR/USD may dip after France’s CPI data is released on January 29 at 07:45 GMT. Forecasts currently stand at 88 with the previous report showing 87. Broadly speaking, economic data coming out of France has been lackluster and frequently falling short of expectations. The Yellow Vest (gilet jaunes) protests have played a crucial role in France’s economic performance, particularly consumer confidence.
Chart of French Consumer Confidence

YELLOW VESTS PROTESTS IMPACT

The protests emerged in the last breaths of 2018. The protesters were motivated primarily by rising fuel prices, the high cost of living and grievances against certain tax codes. The protests turned into riots and eventually devolved into clashes with police and the destruction of property.
The participants involved gave a list of demands, some of which required the repealing of the fuel tax, raising the minimum wage and the resignation of President Emmanuel Macron. As a result of the domestic tribulations, his ratings have plummeted. Meanwhile, nationalist politician Marie La Pen’s popularity has grown, putting France in danger of having a Eurosceptic representation in the European Parliament in 2019.
The disturbance from the protests have only worsened, with a counter-movement known as the “Red Scarves” (foulards rouges) having marched against the initial protestors this past Sunday. This kind of political fissuring and discontent is part of a broader European trend in political fragmentation that may be made more apparent this year in the European Parliamentary (EP) elections in May.
The protests have resulted in trade losses because of blocked routes necessary for transportation along with slower consumption. Other notable indicators that have taken a hit have been the Composite and Services PMI data, coming in at 47.9 and 47.5, undershooting the forecasts of 51 and 50.5, respectively.
The Yellow Vests are now beginning to organize themselves into a political unit and are aiming to participate in the EP elections. They are currently forecasted to win 13 percent of the vote. Macron may also anger Eurosceptics around the continent because his revised budget deficit – as a way to accommodate the protestors demand – may breach the 3 percent threshold. This would put Brussels in a tighter spot with Italy.
As the third largest Eurozone economy – following the UK and Germany – what happens in France politically and economically can bear tremendous implications for the Euro. Growth in Germany is already slowing, Italy is teetering on a recession, and the UK is in the midst of a tangled Brexit arrangement.

EUR/USD OUTLOOK

The Euro, after breaking above a key resistance, appears now to be bouncing off 1.1435, and could potentially head down to 1.1415. If French Consumer Confidence comes in lower than expected, it could cause EUR/USD to break below the latter price level.
EUR/USD – Daily Chart
Chart of EUR/USD
Later this week, a cascade of European economic data will be released primarily on January 31 and February 1. The release of these indicators – particularly Italy’s GDP – will almost certainly impact the Euro. The IMF, ECB and World Bank all have made forecasts of slower growth in Europe. This data will therefore be a key event to monitor because the results could validate the outlooks and exert pressure on the Euro.

Australian Dollar Slips On NAB Business Gloom, Trade Talks Eyed

AUSTRALIAN DOLLAR, NAB BUSINESS CONFIDENCE SURVEY, TALKING POINTS:

  • AUD/USD was marked down after another feeble business survey
  • Overall confidence was steady, but at very low levels
  • The ‘current conditions’ assessment was brutal
The Australian Dollar wilted Tuesday on a very gloomy assessment of current conditions from Australian businesses.
Overall business confidence remained stable in December according to the National Australia Bank’s venerable survey, albeit at very low levels. The index reading of 3 matched November’s print but that was the lowest since January 2016. What really did the damage to AUD/USD, however was that current conditions assessment.
Its reading plunged to just 2, from 11 in November.
Business confidence had been holding up pretty well until the end of last year, but is now running at just half of the survey’s long term average of 6.
Australian business remains very vulnerable to the clear slowdown visible in much Chinese data, given China’s importance to Australia’s raw material export machine. Indeed Australian businesses will be hoping as hard as any that this week’s high level bilateral trade talks between Beijing and Washington will bear some tangible fruit.
Market watchers seem to think that a durable deal remains some way off, even assuming that it is possible. Given that, success is likely to be measured in willingness to pursue further talks and, perhaps, an end to the tit-for-tat tariff raising which made markets so volatile last year.
AUD/USD was clearly hit by the NAB survey and dropped about 30 ticks in short order after its release.
Chart of AUD/USD (5-minute)
On its broader, daily chart AUD/USD remains above the downtrend channel which dominated trade for much of 2018, as US interest rates rose and Australia’s remained doggedly at their record low of 1.50%
The Aussie has bounced into 2019 as investors rethink the likely magnitude of US rate rises ahead and ashopes for a trade breakthrough buoy growth-linked assets like the Aussie.
Chart of AUD/USD (Daily)
It could continue to gain this week if the US Federal Reserve strikes a more dovish tone when it sets monetary policy on Wednesday.
However, Australian rate futures markets now strongly suggest that the next move in Australian interest rates may yet be a fall, even though the Reserve Bank of Australia still insists that a rise is more likely. A near-term steer on who is likely to be right here (and they can’t both be), may come from Wednesday’s Australian inflation data. More weakness is expected with an annualized rise of just 1.7% predicted. If that is seen then the markets are likely to remain convinced that lower rates remain a distinct possibility.
For as long as the Australian Dollar completely lacks interest rate support, it is likely to remain vulnerable. It’s notable that recent AUD/USD strength has not taken the pair past its recent significant high (early December’s 0.7393).

S&P 500, Dow Jones, and Nasdaq 100 Charts Near Resistance

S&P 500/DOW JONES/NASDAQ 100 TECHNICAL HIGHLIGHTS:

  • S&P 500 trading around trend-line
  • Dow Jones has confluent resistance just ahead
  • Nasdaq 100 lagging, has lesser resistance

S&P 500 TRADING AROUND TREND-LINE

The rally off the low in the S&P 500 has been fierce, erasing most of the damage from December. Given the extended state the market is in with its limited set-backs in recent weeks, a pullback is due. If one is to develop then now is as a good time as any to start looking for price action to begin showing signs of a reversal.
The trend-line off the record high is currently being tested and should we see the market turn down from here then would-be shorts may look to play for near-term weakness. A decline below the Jan 23 low at 2612 will help further validate the notion of a decline. If the market continues to push higher beyond the trend-line, there aren’t any significant levels to speak of until the 200-day MA.
S&P 500 DAILY CHART (T-LINE)
S&P 500 daily chart, t-line

DOW JONES HAS CONFLUENT RESISTANCE JUST AHEAD

The Dow is staring down not only a trend-line from the record high but the 200-day MA. This confluence is seen as strong and likely to be problematic for the index moving forward. A bearish daily reversal bar will add conviction.

DOW DAILY CHART (200-DAY/T-LINE)

Dow daily chart, 200-day/t-line

NASDAQ 100 LAGGING, HAS LESSER RESISTANCE

The Nasdaq 100 remains a laggard, which may prove as a sign that it wants to trade lower at a faster pace than the other two major indices. Trend-line resistance from October may put a cap on it, but in any event when the market weakens as some point it will be worth taking note if sellers show up in larger numbers in the NDX.

NASDAQ 100 DAILY CHART (T-LINE)

Nasdaq 100 daily chart, t-line

Wednesday, January 23, 2019

Oil Risks Larger Recovery as Inverse Head-and-Shoulders Takes Shape

OIL TALKING POINTS

Oil prices remain bid even as the International Monetary Fund (IMF) reduces its global growth forecast for 2019 and 2020, and the ongoing efforts by the Organization of the Petroleum Exporting Countries (OPEC)to stabilize the energy market may spur a larger recovery in crude as an inverse head-and-shoulders formation takes shape.
Image of daily change for major financial markets

OIL RISKS LARGER RECOVERY AS INVERSE HEAD-AND-SHOULDERS TAKES SHAPE

Image of daily change for crude oil prices
Fresh comments from OPEC Secretary-General Mohammad Barkindo suggest the group will continue to cut production over the coming months as the official insists that the ‘the market has started to respond positively’ at the World Economic Forum in Davos, Switzerland, and the current environment raises the risk for higher crude prices as Mr. Barkindo goes onto say that ‘we are beginning to see very sharp reductions in supply.’
Image of EIA U.S. field production of crude oil
In fact, OPEC and its allies may curb production throughout 2019 as updates from the U.S. Energy Information Administration (EIA) show field production climbing to 11,900K in the week ending January 11 after holding steady at 11,700K for three consecutive weeks, and the group may continue to combat the stickiness in Non-OPEC supply especially as Russia Minister of Energy, Alexander Novak¸ endorses a price range of $55-65bbl.
With that said, the advance from the December-low ($42.36) may gather pace as oil prices break out of the downward trend carried over from late-2018, with developments in the Relative Strength Index (RSI) fostering a constructive outlook for crude as the oscillator bounces back from oversold territory and carves a bullish formation.
OIL DAILY CHART
Image of crude oil daily chart
  • Crude stages a near-term rebound following the failed attempts to test the June 2017-low ($42.05), and oil prices may continue to track higher as an inverse head-and-shoulders formation takes shape.
  • In turn, a break/close above the $55.10 (61.8% expansion) to $55.60 (61.8% retracement) region raises the risk for a larger reversal, with the next area of interest coming in around $57.40 (61.8% retracement) followed by the Fibonacci overlap around $59.00 (61.8% retracement) to $59.70 (50% retracement).

Friday, January 18, 2019

GBP Rejects 1.30, EUR Looks to ECB, Trade War Optimism Returns - US Market Open

MARKET DEVELOPMENT – GBP REJECTS 1.30, EUR LOOKS TO ECB, TRADE WAR OPTIMISM RETURNS
USD: With the US set to have an elongated weekend with MLK day on Monday, price action in major G10 currencies has been somewhat calmer with little short-term drivers for now. Overnight reports via WSJ stating that US Treasury Secretary Mnuchin proposes to lift import tariffs on China had boosted risk sentiment, alongside high beta currencies (AUD, NZD). However, these reports had been quickly denied. Despite this, the view that the expectation that the Trump administration and China could reach an agreement is seemingly nearer. Eyes on Chinese Vice Premier’s trip to Washington from January 30thUSDindex continues to consolidate above 96.00 for now.
GBP: After the largest daily rise against the greenback in a month, GBP has pulled back heading into the weekend, with the rejection at the 1.30 handle providing an opportune moment to scale back exposure slightly. Headline risk remains elevated; however, the narrative has moved to a somewhat softer Brexit following Theresa May’s sizable meaningful vote defeat. Consequently, with no-deal Brexit risks receding and expectations building for an extension to Article 50, GBP seems cheap at current levels with dips presenting opportunities for upside. The next look at Theresa May’s revised withdrawal agreement will take place on Monday.
EURThe Euro continues to stick within its 1.13-1.15 range with little signs of a breakout. Eurozone data persists on surprising to the downside as shown in the Citi Economic Surprise Index. Although, this has not yet rung major alarm bells for President Draghi who continued to provide an upbeat, while also acknowledging the weak data points. As such, don’t expect fireworks from next week’s ECB meeting with the Draghi and Co. likely to stick to the same narrative. Alongside this, option markets also suggest indecision for EURUSD with risk reversals almost neutral (showing slight put bias). For now, the base in EUR is set at 1.1210, a slight pick-up in data is needed for the currency to press for better levels and eye a move to 1.16.
GoldHaving rejected the $1300/oz level, the precious metal has experienced a pullback towards $1285 amid the rise in equity markets sapping safe haven flow from gold, while the pick-up in US treasury yields has also weighed. Eyes are now set on a $1280, which could open a move towards $1264 before a move to the upside. Given the deteriorating outlook for the global economy, longer term risks still favour upside for gold with a longer-term view to $1360.
Economic Calendar– North American Releases
GBP Rejects 1.30, EUR Looks to ECB, Trade War Optimism Returns - US Market Open
Client Sentiment
GBP Rejects 1.30, EUR Looks to ECB, Trade War Optimism Returns - US Market Open

Lackluster Canada Consumer Price Index (CPI) to Curb USD/CAD Losses

TRADING THE NEWS: CANADA CONSUMER PRICE INDEX (CPI)
Updates to Canada’s Consumer Price Index (CPI) may do little to alter the near-term outlook for USD/CADas the headline reading for inflation is expected to hold steady at 1.7% per annum for the second month in December.
Image of DailyFX economic calendar
Signs of limited price growth is likely to sap the appeal of the Canadian dollar as it encourages the Bank of Canada (BoC) to endorse a wait-and-see approach for monetary policy, and the central bank may merely attempt to buy more time at the next meeting on March 6 as ‘CPI inflation is projected to edge further down and be below 2 per cent through much of 2019.’
In turn, a 1.7% print or lower may prop up USD/CAD ahead of the weekend, but an unexpected pickup in the headline reading for inflation may fuel the decline from earlier this month as it puts pressure on Governor Stephen Poloz & Co. to further embark on its hiking-cycle over the coming months. 
IMPACT THAT CANADA’S CPI HAS HAD ON USD/CAD DURING THE PREVIOUS RELEASE
Period
Data Released
Estimate
Actual
Pips Change
(1 Hour post event )
Pips Change
(End of Day post event)
NOV
2018
12/19/2018 13:30:00 GMT
1.8%
1.7%
+6
+42
November 2018 Canada Consumer Price Index (CPI)
USD/CAD5-Minute Chart
Image of usdcad 5-minute chart
Canada’s Consumer Price Index (CPI) slipped to 1.7% from 2.4% per annum in October, with two of the three gauges for core inflation also narrowing during the same period. A deeper look at the report showed the weakness was drive by a 9.4% decline in gasoline prices, with transportation costs also contracting 1.6%, while prices for food increased 1.0% after falling 0.2% in October.
The Canadian dollar struggled to hold its ground following the weaker-than-expected figures, with the exchange rate tracking higher throughout the day to close at 1.3484. 
USD/CAD DAILY CHART
Image of usdcad daily chart
  • Keep in mind, broader outlook for USD/CAD remains constructive following the break of the June-high (1.3386), but the failed attempts to close above the 1.3630 (38.2% retracement) to 1.3660 (78.6% expansion) region raises the risk for a larger correction as both price & the RSI snap the bullish formations from October.
  • String of failed attempts to push back above the 1.3290 (61.8% expansion) to 1.3310 (50% retracement) region brings the downside targets on the radar as a bear-flag formation takes shape.
  • A short-term continuation pattern would raise the risk for a move back towards 1.3130 (61.8% retracement), with the next region of interest coming in around 1.2980 (61.8% retracement) to 1.3030 (50% expansion).