fundamental analysis: October 2018

Tuesday, October 30, 2018

Cryptocurrencies Under Increased UK Regulatory Scrutiny


Bitcoin (BTC), Ethereum (ETH), Ripple (XRP): Prices, Charts and News
  • UK Cryptoasset Taskforce warns of ‘substantial potential risks’.
  • Cryptocurrencies fade lower in thin market conditions.

UK REGULATOR RELEASES CRYPTOASSET UPDATE

The UKCryptoasset Taskforce -consisting of HM Treasury, the Financial Condust Authority (FCA) and the Bank of England – has released a paper warning that there are ‘substantial potential risks associated with cryptoassets, and the most immediate priorities for the authorities are to mitigate the risks to consumers and market integrity and prevent the use of cryptoassets for illicit activity'. The report concludes that strong action should be taken ' to address the risks associated with cryptoassets that fall within existing regulatory frameworks’.
The report adds that the authorities will consult on, among other areas,
‘a potential prohibition of the sale to retail consumers of derivatives referencing certain types of cryptoassets (for example, exchange tokens), including CFDs, options, futures and transferable securities’.
Market reaction to the report saw cryptocurrencies shed 3%-5%, pushing some coins back to noted support levels and the overall market capitalization to just above $200 billion, a six-week low. The cryptocurrency market has traded in a tight range over the last few weeks and volume remains low.
Bitcoin (BTC) currently trades around $6,250, just above horizontal support at $6,110, a break of which would open the way back to the August 15 low at $5,887. Bitcoin is below all three moving averages.

BITCOIN (BTC) DAILY PRICE CHART (JUNE – OCTOBER 30, 2018)

Cryptocurrencies Under Increased UK Regulatory Scrutiny
Ethereum (ETH) is back below $200, and all three moving averages, and is eyeing support at $186.5 ahead of $167.6.

ETHEREUM (ETH) DAILY PRICE CHART (JUNE – OCTOBER 30, 2018)

Cryptocurrencies Under Increased UK Regulatory Scrutiny
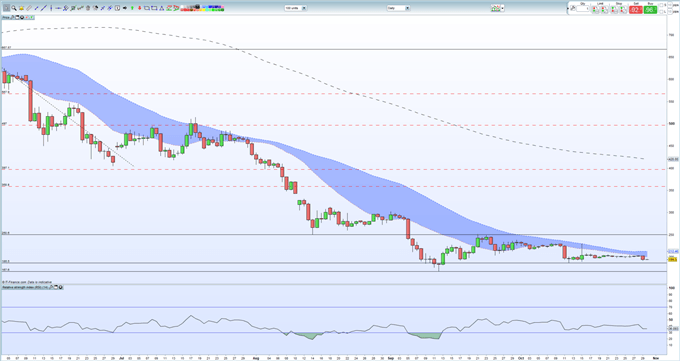
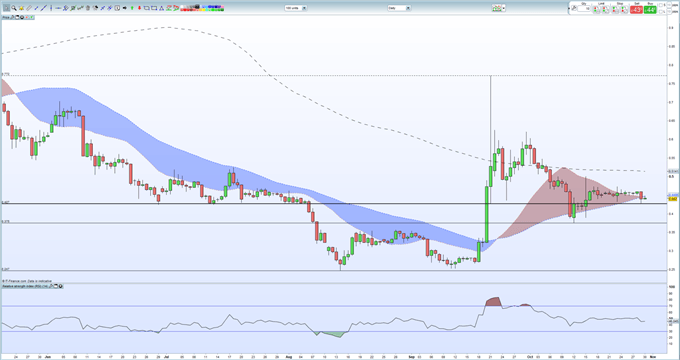
Ripple (XRP) is not immune to the sell-off and trades around $0.44, sharply lower than the September 21 ‘spike-high’ of $0.77. Support is seen at $0.427 ahead of $0.375. Ripple also trades below all three moving averages.

RIPPLE (XRP) DAILY PRICE CHART (JUNE – OCTOBER 30, 2018)

Cryptocurrencies Under Increased UK Regulatory Scrutiny

Technical Outlook for USD Index, EUR/USD, AUD/NZD, Gold Price & More

The Euro tried to reverse on Friday but failed to garner any follow-through, bringing the August low into play. This has the DXY on its way higher, giving dollar longs the benefit of the doubt, overall. AUD/NZDthoroughly tested neckline resistance but was rejected yesterday. This shifts momentum back in-line with the breakdown from earlier this month. Gold finally pulls off resistance, bringing support levels a bit lower into view.

TECHNICAL HIGHLIGHTS:

  • US Dollar Index (DXY) treading around resistance
  • EUR/USD not showing much life after Friday’s reversal
  • AUD/NZD turned down from H&S neckline
  • Gold price turning strongly lower from resistance
US DOLLAR INDEX (DXY) TREADING AROUND RESISTANCE
The US Dollar Index (DXY) turned hard from resistance on Friday, suggesting perhaps a move lower might be in store. However, trend-line support on the 4-hr kept a bid in and with that we are now seeing an attempt to trade above the August high of 96.98. If it does, the next level (or line in this case) of resistance clocks in at a trend-line crossing over from a year-ago. The benefit of the doubt remains with longs for now.

US DOLLAR INDEX (DXY) DAILY CHART (TRYING TO BREAK OUT)

dxy daily chart, trying to break out

EUR/USD NOT SHOWING MUCH LIFE AFTER FRIDAY’S REVERSAL

The Euro’s reversal on Friday failed to bring with it much more buying interest. The largest driving component of the DXY is now pushing towards the August low at 11301. On a break through 11301 the underside trend-line from November will come into focus in the low-11200s.

EUR/USD DAILY CHART (AUGUST LOW COMING UP)

eurusd daily chart, August low coming up

AUD/NZD TURNED DOWN FROM H&S NECKLINE

The neckline of the head-and-shoulders formation broke during the middle of the month and was thoroughly tested to end last week, start the current one. The turn down yesterday was fairly fierce and seen as likely the worst of the retest. Stay below 10900 and the pattern remains firmly intact for lower prices.

AUD/NZD DAILY CHART (TURNING DOWN FROM NECKLINE)

aud/nzd daily chart, turning down from neckline

GOLD PRICE TURNING STRONGLY LOWER FROM RESISTANCE

Gold posted a key reversal on Friday after probing a bit further into resistance via lows from the end of 2017 to more recent along with the upper parallel of the channel off the August low. The turn down is seen as bringing into play the 1214/10-area from August/September and possibly the lower parallel if selling picks up momentum.

GOLD DAILY CHART (COMING OFF CONFLUENCE OF RESISTANCE)

gold daily chart, coming off confluence of resistance

EURUSD Threatens to Test Crucial Support as Growth Tilts to Downside


EUR Analysis and Talking Points
  • Eurozone Growth Risks Tilted to the Downside
  • Italian Growth Stagnates
  • ECB to Cut Growth Forecasts in Staff Projections
  • German Inflation May Stem Euro Losses

EUROZONE GROWTH RISKS TILTED TO THE DOWNSIDE

The first insight into Q3 growth in the Eurozone showed a drop to 1.7% from 2.1%, falling below estimates of 1.8% with a quarterly rise of 0.2%. This report is consistent with the theme that growth in the Eurozone is slowing with uncertainty in Germany posing downside risks to the growth outlook. Last week’s PMI had also highlighted the weakness in the Eurozone with IHS Markit noting that the slowdown is being led by a drop-in exports, linked to trade wars and tariffs.

ITALIAN GROWTH STAGNATES

Earlier, Italian Q3 growth statistics underwhelmed analyst estimates with the economy stagnating for the first time since Q4 2014. This will provide a blow to the Italian government, whose growth projections in their budget are seemingly far too optimistic. However, at the same time it will strengthen their calls that they need an expansive budget in order to invest more and subsequently support growth.

ECB TO CUT GROWTH FORECASTS IN STAFF PROJECTIONS

Given the continued deterioration in the growth outlook, expectations are on the rise that the ECB will lower its growth forecasts in the staff projections at the December monetary policy meeting.
GERMAN INFLATION MAY STEM EURO LOSSES
Thus far, German state inflation suggests possible upside risks to the national German CPI reading with the Saxony CPI rising 2.5% from 2.3%, which marks the highest figure since 2008. This is also above the expected reading for the national print, which is seen rising 2.4%, whereby a match would see German inflation rising at its fastest pace since November 2011. Although, with Germany’s most populous state North Rhine-Westphalia reporting a yearly rate of 2.4%, the headline figure may be more skewed to 2.4%. This in turn, could reinforce the ECB’s plan to end bond purchases by the year-end and look to provide guidance on the first-rate rise.

EURO APPROACHES KEY SUPPORT AT 1.13

Key support in the Euro is situated at the 1.13 handle, which marks the YTD low. While near term topside resistance resides at the 1.14 handle (1.4bln worth of vanilla options) and 1.1430. A break below 1.13 could open up a move towards the 1.1180 level, whereby the 61.8% Fibonacci retracement of the 1.0340-1.2555 rise comes in at. Month-end rebalancing poses downside risks to the Euro with bank models implying that signals point to strong USD buying.

EURUSD PRICE CHART: DAILY TIME-FRAME (MAY-OCT 2018)

EURUSD Threatens to Test Crucial Support as Growth Tilts to Downside

Yen May Extend Drop as Aussie Dollar Gains, But Not for Long

TALKING POINTS – AUSSIE DOLLAR, YEN, STOCKS, TRADE WAR, EURO

  • Yen down, commodity currencies up as Trump talks up China trade deal
  • Sentiment recovery unlikely to prove lasting as macro headwinds remain
  • Eurozone GDP, German CPI data to bolster the case for Euro weakness
Recovering risk appetite defined G10 FX performance in Asia Pacific trade. The sentiment-geared Australian, Canadian and New Zealand Dollars rose alongside regional stock exchanges while the perennially anti-risk Japanese Yen ticked broadly lower.
An ostensible downshift in trade war worries drove the move. That followed comments from US President Donald Trump talking up the possibility of a “great” trade deal with China, tamping down earlier fears of further tariff hikes.
Bellwether S&P 500 futures are pointing convincingly higher ahead of the opening bell on Wall Street, hinting that the risk-on drive has scope for follow-through. Critically though, a lasting recovery would require substantive resolution on a host of macro-level issues. That, alas, does not seem to be on offer.

RECOVERY IN RISK APPETITE UNLIKELY TO LAST

A deal with China may well emerge eventually, but nothing suggests this is imminent. Further, headwinds from accelerating Fed rate hikes against a backdrop of slowing global growth and numerous pockets of political uncertainty – stalled Brexit talks and Italy’s tiff with the EU, for example – remain.
On balance, that suggests the markets’ readiness to emphatically embrace even the most trivial bit of encouragement reflects the extent of recent bloodletting and the accompanying need for a respite rather than a true improvement in the overall landscape. Such recoveries are brittle as a matter of course.

INCOMING DATA MAY BOLSTER THE CASE FOR EURO WEAKNESS

On the data front, Eurozone GDP statistics are expected to put regional growth at 1.8 percent on-year in the third quarter, the slowest in two years. Meanwhile, the German CPI report is projected to show inflation hit a seven-year high at 2.4 percent on-year in October.
Taken together, this speaks directly to the problem now faced by the ECB, explaining why the central bank’s rhetoric took a dovish turn last week (as expected). Namely, the recent rise in price growth is occurring for all the wrong reasons, reflecting a weaker currency rather than improved performance.
Further evidence to this end seems likely to bode ill for the Euro over time. Absent particularly eye-catching deviations from forecasts however, near-term volatility triggered in the releases’ wake seems unlikely to have staying power considering the ECB looks to be on autopilot at least through year-end.

ASIA PACIFIC TRADING SESSION

Asia Pacific Trading Session Economic Calendar

EUROPEAN TRADING SESSION

European Trading Session Economic Calendar
** All times listed in GMT

Wednesday, October 17, 2018

GBP/USD Price Outlook: Sterling Trade Levels for Upcoming Brexit Talks

  • GBP/USD at risk ahead of EU/UK Brexit talks – price constructive while above monthly open
The British Pound continues to trade within the weekly opening-range heading into the EU/UK Brexit negotiationsHere are the updated targets and invalidation levels that matter on the GBP/USD charts this week

GBP/USD DAILY PRICE CHART

GBP/USD Price Chart - Daily
Technical Outlook: GBP/USD has been trading within the confines of this descending pitchfork formation extending off the yearly highs – we highlighted the threat of a larger pullback in the British Pound last weekas price was carving out an outside-day reversal off the 75% slope line. Note that daily RSI failed at the 60-threshold and further highlights the near-term risk for steeper losses here.
That said, the broader outlook remains weighted to the topside while above the August trendline with initial daily support eyed at the 100-day moving average (currently ~1.31) backed by the October open at 1.3031- we’re on the lookout for downside exhaustion off one of these levels. A topside breach of the monthly range highs looks to challenge more significant resistance at the confluence of the December low, the September highs and the 38.2% retracement at 1.3302/17 and the upper parallel around ~1.3360s.

GBP/USD 240MIN PRICE CHART

GBP/USD Price Chart - 240min
Notes: A closer look at near-term price action shows Sterling holding a within a clean weekly opening-rangejust below the 100% extension of the monthly advance at 1.3239. A break below 1.3090 targets confluence support at 1.3031/50- an area of interest for possible long-entries IF reached. Weakness beyond this region would invalidate the monthly advance with such a scenario risking a decline back towards 1.2877-1.2905.
Bottom line: Sterling has carved out a clear weekly opening-range and we’re looking for the break for offer further guidance. From a trading standpoint, I’ll favor fading weakness while above monthly open support with a breach above 1.3239 needed to fuel the next leg higher in price. Keep in mind there is considerable event risk on the horizon with EU-UK Brexit summit likely to dominate the headlines over the next 48 hours – tread lightly.

GBP/USD TRADER SENTIMENT

GBP/USD Trader Sentiment

    Tuesday, October 16, 2018

    NZD Firms on Inflation Jump, Strong Wages Buoy GBP - US Market Open

    MARKET DEVELOPMENT – GBP AND NZD SHINE, USD BULLS AT RISK
    GBP: Sterling rose to session highs after the latest employment report with UK wages beginning to show some signs of life. The BoE focussed wage components rose above analyst estimates with the ex-bonus figure rising to the highest level since January 2009 at 3.1%. This also backs up recent commentary from BoE Chief Economist Haldane, who stated that wages are a growing source of inflationary pressures and as such will monitor closely. Elsewhere, Brexit rhetoric ahead of the EU summit continues to suggest that while progress has been made, key issues, most notably the Irish border, are still yet to be resolved.
    USD: Risk sentiment is firmer this morning with US equity markets trading higher, consequently, this has seen high beta currencies favoured over the USD, which has now made a firm break below the 95.00 handle. A close below the 23.6% Fibonacci retracement of the 2018 low to 2018 high could spell trouble for the crowded bullish bets.
    NZD: The Kiwi is flying high this morning after NZ inflation figures rose above analyst estimates with the headline reading rising to 1.9% from 1.5%. A large factor behind the jump had been the higher energy prices, coupled with the falling exchange rate in the third quarter.
     Tuesday, October 16, 2018 – North American Releases
    NZD Firms on Inflation Jump, Strong Wages Buoy GBP - US Market Open
    Tuesday, October 16, 2018
    NZD Firms on Inflation Jump, Strong Wages Buoy GBP - US Market Open
     NZDUSD Chart of the Day
    NZD Firms on Inflation Jump, Strong Wages Buoy GBP - US Market Open
    NZDUSD: Retail trader data shows 83.0% of traders are net-long with the ratio of traders long to short at 4.87 to 1. In fact, traders have remained net-long since Sep 20 when NZDUSD traded near 0.65728; price has moved 0.4% lower since then. The number of traders net-long is 2.3% higher than yesterday and 4.8% higher from last week, while the number of traders net-short is 2.0% lower than yesterday and 3.9% lower from last week.
    We typically take a contrarian view to crowd sentiment, and the fact traders are net-long suggests NZDUSD prices may continue to fall. Traders are further net-long than yesterday and last week, and the combination of current sentiment and recent changes gives us a stronger NZDUSD-bearish contrarian trading bias.

    Monday, October 15, 2018

    ASX 200 Price Gain May Reverse as Asia Stocks Rise, JPY & CHF Down

    ASIA PACIFIC MARKET WRAP – ASX 200 CHART, US BOND YIELDS, US DOLLAR, JAPANESE YEN

    • Most Asia Pacific benchmark stock indexes trimmed gains as US bond yields rose
    • New Zealand Dollar parred upside progress as US Dollar recovered, Yen weakened
    • ASX 200 prices may resume aggressive downtrend if China GDP slows later on

    The New Zealand Dollar pared some of its gains following a better-than-expected local inflation reportduring Tuesday’s Asia Pacific trading session. Interestingly, the RBNZ’s gauge of core inflation remained unchanged following the headline data, but that didn’t seem to be the reason why it lost some upside momentum later on.
    While most APAC benchmark stock indexes traded cautiously higher (China’s Shanghai Composite was down 0.15%), some of those gains were pared later on. The Nikkei 225’s climb was somewhat reduced to only +0.21% and S&P 500 futures fared a similar fate. Australia’s ASX 200 fared better though with gains holding around +0.56 percent heading into Tuesday’s close.
    The rather cautious upbeat mood in the markets was matched with a climb in US government bond yields towards the latter half of the maturity spectrum. Not surprisingly, this was accompanied by a partial recovery in the US Dollarwhich might have robbed NZD from some of its gains. Anti-risk currencies such as the Japanese Yen and Swiss Franc traded lower.
    Over the remainder of the day, stocks and FX will look to geopolitical developments for their next move. We will get a speech from Italy’s Prime Minister Giuseppe Conte ahead of the EU leaders summit. EU Chief Negotiator Michel Barnier is to present Brexit summit conclusions. Looking more outward, there is a risk for emerging markets and equities if Chinese economic growth continues slowing.

    ASX 200 TECHNICAL ANALYSIS

    The ASX 200, while seeing a small recovery on Tuesday, is still in an aggressive downtrend that followed a formation of an evening star bearish reversal pattern back in late August. Since then, the index has retraced around 77 percent of gains seen from the April 2018 low to the August 2018 high.
    At the moment, near-term support appears to be holding at 5,795.90 (February 2018 lows). Immediate resistance could cap gains around 5,896.60. Should Chinese economic growth slow later this week as mentioned earlier, we may see a descent through 5,795.90 expose 5,724.80.
    ASX 200 Daily Chart
    ASX 200 Price Gain May Reverse as Asia Stocks Rise, JPY & CHF Down

    Uptick in New Zealand Consumer Price Index (CPI) to Fuel NZD/USD Rebound

    TRADING THE NEWS: NEW ZEALAND CONSUMER PRICE INDEX (CPI)

    Updates to New Zealand’s Consumer Price Index (CPI) may fuel the recent rebound in NZD/USD as the headline reading for inflation is expected to widen to 1.7% from 1.5% per annum in the second-quarter of 2018.
    Image of DailyFX economic calendar
    Signs of stronger price growth may heighten the appeal of the New Zealand dollar as it puts pressure on the Reserve Bank of New Zealand (RBNZ) to lift the official cash rate (OCR) off of the record-low, and the central bank may start to change its tune at the next meeting on November 7 especially as ‘GDP growth in the June quarter was stronger than we had anticipated.’
    However, a below-forecast print may rattle NZD/USD as it encourages the RBNZ to carry the wait-and-see approach into 2019, and Governor Adrian Orr & Co. may keep the door open to further support the economy as ‘downside risks to the growth outlook remain.’ 

    IMPACT THAT THE NEW ZEALAND CPI REPORT HAS HAD ON NZD/USD DURING THE LAST RELEASE

    Period
    Data Released
    Estimate
    Actual
    Pips Change
    (1 Hour post event )
    Pips Change
    (End of Day post event)
    2Q
    2018
    07/16/2018 22:45:00 GMT
    1.6%
    1.5%
    +16
    +15
    2Q 2018New Zealand Consumer Price Index (CPI)
    NZD/USD 15-Minute Chart
    Image of nzdusd 15-minute chart
    New Zealand’s Consumer Price Index (CPI) picked up during the three-months through June, with the headline reading climbing to 1.5% from 1.1% per annum in the first-quarter of 2018. A deeper look at the report showed the weakness was led by a 5.6% decline in the cost for fruits/vegetables, with prices for clothing also narrowing 1.2% from the previous year, while transportation costs increased another 2.0% on the back of higher energy prices.
    Household spending in New Zealand increased 0.1% during the first three-months of 2018, with the previous reading revised down to reflect a 1.4% expansion versus an initial reading of 1.7%. A deeper look at the report showed demand for electrical goods increasing 5.4%, with sales of furniture/housewares climbing 2.4%, while discretionary spending on clothing/footwear narrowed 5.0% during the same period.
    NZD/USD bounced back from 0.6755 region despite the below-forecast print, with NZD/USD largely holding steady throughout the remainder of the day as the exchange rate closed at 0.6783. Learn more withthe .

    NZD/USD DAILY CHART

    Image of nzdusd daily chart
    • Broader outlook for NZD/USD remains tilted to the downside as both price and the Relative Strength Index (RSI) track the bearish formations from earlier this year, but the lack of momentum to break below the 0.6370 (50% retracement) to 0.6430 (78.6% expansion) hurdle raises the risk for a near-term rebound.
    • In turn, the 0.6600 (23.6% retracement) to 0.6630 (78.6% expansion) region sits on the radar as it largely lines up with channel resistance, with a break of the bearish structure raising the risk for a change in NZD/USD behavior.
    • Next topside region of interest comes in around the former-support zone around 0.6710 (61.8% expansion) to 0.6720 (61.8% expansion) followed by the Fibonacci overlap around 0.6780 (100% expansion) to 0.6790 (50% expansion).

    Sunday, October 14, 2018

    Franc and Yen Aim Higher as European Politics Sour Market Mood


    TALKING POINTS – SWISS FRANC, YEN, POUND, BREXIT, KRONA, SWEDEN

    • Franc and Yen rise as European politics undermine risk appetite
    • Pound down as Brexit talks stall, Sweden coalition-building fails
    • Upbeat US retail sales statistics may amplify risk-off momentum
    The Swiss Franc outperformed as worries about EU politics soured sentiment at the start of the trading week. The likewise anti-risk Japanese Yen was not far behind. Brexit talks appeared to stall, souring recent hopes for an imminent breakthrough and sinking the British Pound. Meanwhile, coalition-building efforts failed in Sweden, underscoring yet another pocket of EU-linked instability and punishing the Krona.
    SENTIMENT MAY SOUR FURTHER, US RETAIL SALES ON TAP
    Looking ahead, a quiet offering on the European data docket hints sentiment is likely to remain at the forefront. That seems to leave moves seen in Asia Pacific trade with room for follow-through. The bellwether S&P 500 index futures are pointing substantively lower before bourses in Europe and North America come online, hinting that a risk-off bias will continue to prevail.
    That may be amplified by September’s US retail sales statistics. They are expected to show that receipts added 0.6 percent, broadly returning to trend average after a tepid 0.1 percent gain in August. Leading PMI data bolsters the case for an upbeat result, as does a recent improvement in broad-based US data outcomes relative to baseline forecasts.
    Worries about the pace of Federal Reserve interest rate hikes were at the heart of last week’s brutal market rout. To the extent that firm US economic news-flow underpins policymakers’ hawkish stance, it may – perhaps somewhat counterintuitively – weigh on risk appetite. Meaningful follow-through on this narrative might have to wait for Wednesday’s release of minutes from September’s FOMC meeting however.

    ASIA PACIFIC TRADING SESSION

    Asia Pacific Trading Session Economic Calendar

    EUROPEAN TRADING SESSION

    European Trading Session Economic Calendar
    ** All times listed in GMT