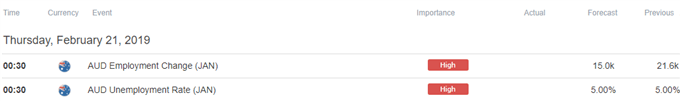
TRADE WARS, US DOLLAR, JAPANESE YEN, KOREAN WON – TALKING POINTS
- US Dollar and Yen may rise if Japan, South Korea trade war fuels demand for anti-risk assets
- Weakness in the Korean Won may be mitigated by fiscal and monetary policy FX intervention
- USD/JPY may extend declines on long-term technical bearish pattern as USD/KRW wobbles
JAPAN, SOUTH KOREA TRADE WAR
Japan and South Korean trade relations over the past two months have soured as the conflict threatens to disrupt a critical node in the global tech supply chain, potentially benefiting the US Dollar. The origin of the dispute – much like other issues the world is being afflicted by – is political. The underlying source of tensions between the two dates back to Japan’s occupation of Korea during World War II.
Last year, the South Korean Supreme Court ruled that several Japanese companies had to compensate the victims wartime forced labor victims. Tokyo responded that restitution had already been paid through an agreement made in 1965. Amid this dispute, on July 1, Japan restricted the export of hydrogen fluoride gas, fluorinated polyimide and photoresists – all key chemical inputs used to make semiconductors, flat screens and other high-tech products.
Officials in Tokyo cited national security grounds behind their decision to restrict the sale of these key inputs because they can also be used in military hardware. Japan expressed concern that unspecified South Korean companies may have allowed North Korea to access some of these chemicals. Seoul has denied the accusation, though this appears to not have convinced Japan.
Japanese companies will now have to deal with more paperwork and a lengthy permit application process which could cause delays and threaten to disrupt a critical tech supply chain. South Korea is the biggest manufacturer of dynamic random-access memory (DRAM) semiconductors in the world, and home to Samsung and SK Hynix, two key producers of critical inputs used in high-tech hardware.
South Korea Kospi Index Overlaid with Samsung, SK Hynix
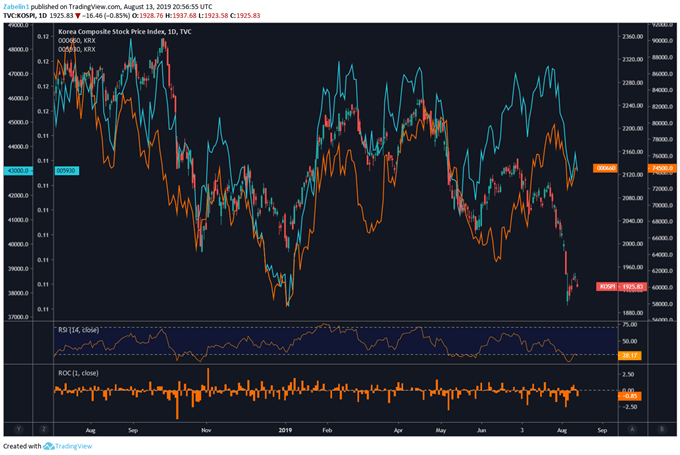
Kospi chart South Korea also recently announced that it is dropping Japan from its white list of trade partners that allows for “fast-track trade status” after Japan pulled a similar lever earlier this month. Both countries are already struggling with slower Chinese growth amid Beijing’s trade war with the US. A bilateral deterioration between Seoul and Tokyo could hamper regional growth which may ripple out and affect global financial markets.
Both sides appear to be digging in their heels as South Korean officials state that they will not be “defeated again” by Japan. Broadly speaking, the tiff appears to reflect political contagion following the US’ recent willingness to sidestep international trade dispute resolution mechanisms through multilateral institutions like the WTO. This has created an environment where – to quote Joseph Stiglitz – almost “everything is acceptable, and no one is accountable.”
Looking ahead, the US will probably have to help reconcile the historical wounds between the two and prevent further deterioration in light of North Korea’s more aggressive display of military might. However, Seoul and Tokyo are both facing an unpredictable administration that is working to mediate their dust-up even as it undermines each country’s growth prospects with its tariff-based approach to regional commerce.
IMPACT ON US DOLLAR, JAPANESE YEN AND KOREAN WON
So far this year, amidst trade wars and in spite of rising expectations of easing by the Federal Reserve, the US Dollar has by and large outperformed against its major counterparts. This likely owes to its status as a safe-haven currency, thanks to its unrivaled liquidity. If tensions between Japan and South Korea undermine global growth prospects, USD may continue to outperform.
This is also what the anti-risk Japanese Yen could be facing if a premium for preserving capital arises. The Bank of Japan is in cruise-control mode, supporting an economy suffering from anemic price growth. Low inflation works to maintain the value of Yen over time. This makes it a prime candidate as a funding currency in carry trades. When risk aversion kicks in and yield-seeking carry exposure is unwound, the buying back of JPY tends to boost it.
As for the Korean Won and the vulnerabilities it faces if tensions between Tokyo and Seoul escalate, there may be a chance that declines only go so far. That is because earlier this month, South Korean Finance Minister Hong Nam-ki said that the government will make an “all out” effort to stabilize markets. This also includes taking preemptive steps in the event of FX instability.
On top of this, Bank of Korea (BOK) Governor Lee Ju-yeol said that the central bank could cooperate with the government, making for strong fiscal and monetary policy intervening efforts. The KRW has already been facing selling pressure as the BOK delivered an interest rate cut from 1.75% to 1.50% in July. The central bank has mentioned that it is closely watching Japan’s export restrictions.
USD/JPY TECHNICAL ANALYSIS
In the medium-term, USD/JPY could face a resumption of the dominant downtrend going back to 2015 as outlined in the third quarter technical forecast. The currency pair took out rising support from 2016, eyeing the January “flash crash” low. Near-term signals point to corrective gains with positive RSI divergenceshowing fading momentum to the downside. Resistance appears to be a range between 106.78 and 107.21.
USD/JPY Daily Chart
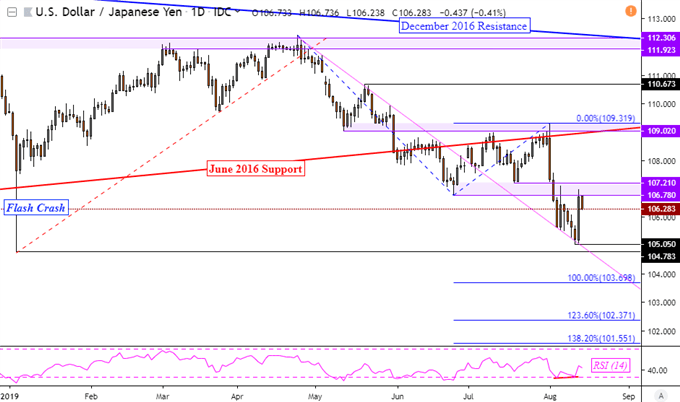
USD/JPY Chart Created in TradingView
USD/KRW Technical Analysis
Meanwhile, the USD/KRW is struggling to extend its uptrend from the end of June after support was established between 1148.90 and 1152.50. Negative RSI divergence does show fading upside momentum as resistance holds between 1215.91 and 1223.46. A turn lower places support as the rising trend line from July, Otherwise, clearing resistance exposes highs from February 2016 around 1244.30.
USD/KRW Daily Chart
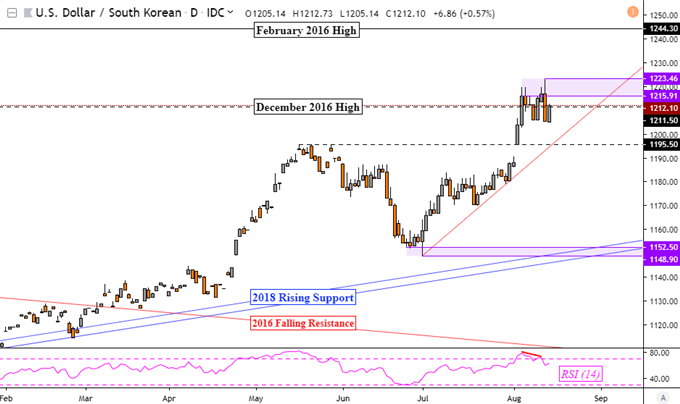
USD/KRW Chart