fundamental analysis: November 2018

Thursday, November 22, 2018

GBPUSD Price Technically Weak Ahead of Crucial Brexit Talks

GBP PRICE, NEWS AND ANALYSIS:

  • The coming weekend will be of major importance for Sterling traders.
  • Ahead of it, GBPUSD is looking technically weak so a slide lower is possible.

BREXIT TALKS CRUCIAL FOR GBP OUTLOOK

A crunch weekend for the Brexit negotiations between the UK and the EU is fast approaching and the outcome of the talks will be of major importance for the GBPUSD price, with an agreement positive for the Pound and no agreement negative.
Ahead of those negotiations, the GBPUSD chart is looking weak so, from a technical perspective, the bias is to the downside.

GBPUSD PRICE CHART, DAILY TIMEFRAME (AUGUST 23 – NOVEMBER 22, 2018)

Latest GBPUSD price chart
As the chart above shows, the GBPUSD price has broken downwards from a symmetrical wedge pattern, suggesting further weakness ahead. For the past week it has been consolidating below the wedge-pattern support line and any further decline would bring the recent lows into focus: 1.2696 touched on October 30, 1.2700 reached on October 31 and at November 15’s 1.2724.
With the price already below the 50-day, 100-day and 200-day moving averages, a new downtrend is already in place and any fall in the 50 dma below the 100 dma would emphasize it.

BREXIT TALKS IN FOCUS

UK Prime Minister Theresa May will be back in Brussels Saturday to discuss future ties between the UK and the EU ahead of a major EU Summit Sunday. However, German Chancellor Angela Merkel will not attend the Summit unless agreement can be reached before then on vexed issues such as the status of Gibraltar, EU fishing rights in UK waters and UK access to the EU single market. If Merkel does indeed not attend, that could prompt a further decline in GBPUSD and the GBP crosses.
In addition, there is concern that any agreement would not be passed by the UK Parliament, and Northern Ireland’s Democratic Unionist Party – which May relies on for her Parliamentary majority – is against the current plans.
On the upside for GBP, May seems to have beaten off for now a challenge to her leadership, strengthening her hand in the negotiations and potentially GBPUSD too.

Wednesday, November 21, 2018

Asian Stocks Mixed, Chinese Mainboards Sag On Trade Worries

Asian Stocks Talking Points:
  • Regional bourses put in a mixed performance
  • Chinese stocks were the standout laggards
  • The US Dollar slipped a little as overall risk appetite held up
Asia-Pacific equity put in a mixed performance Thursday ahead of the market-thinning US Thanksgiving break.
Trade tensions with the US seemed to hold back Chinese bourses. The Shanghai Composite was down 0.6% as its close approached, with the Hang Seng off by 0.1%, paring earlier losses. Other mainboards managed to gain though, with the Nikkei 225 up 0.5% and Australia’s ASX 200 adding 0.9%. There seemed to be no one particular story behind the latter’s rise, although the banking sector was in vogue again after a battering earlier this week.
The ASX 200 is still flirting with lows not seen since December 2016 this week. The US holiday may make short-term direction hard to gauge, but at present another move lower looks like the most likely technical prospect.
The US Dollar drifted lower as overall risk appetite seemed to have improved somewhat, while the Euromade some gains as markets hoped for a resolution of Italy’s budgetary impasse with the European Union. USD/JPY was steady after news that Japanese inflation remains mired. The core measure stripping out volatile food and fuel price effects came in at an annualized 1.0% for October. The Bank of Japan’s target of a sustainable rate above 2% remains a distant dream.
Crude oil prices slipped, reportedly as investors looked ahead to what they think will be rising US inventories, and despite the prospect of OPEC supply cuts. Gold prices edged back down as risk appetite held up. Thursday’s economic calendar is light, but will include the European Central Bank’s account of its last monetary policy meeting. Eurozone consumer confidence figures are coming up too, as is the latest snapshot of Switzerland’s industrial output. Mexico’s inflation data re on the docket too.

EUR/GBP Technical Analysis: Upside Breakout Struggling, May Fail

EUR/GBP TECHNICAL ANALYSIS

  • EUR/GBP struggling to confirm a reversal of the dominant downtrend from August
  • Confirmation requires pushing above 0.89394, but upside momentum is fading fast
  • Euro may weaken versus the British Pound, exposing 0.87961 followed by 0.87518
In the aftermath of EUR/GBP’s largest climb in a single day since June 2016, the pair is attempting to overturn its dominant downtrend. Looking at the daily chart below, the Euro climbed against the British Pound above the descending trend line from August. However, further upside progress was notably lacking and EUR/GBP was unable to push above the October high.
In its attempt to do that, a horizontal range of resistance has formed between 0.89235 and 0.89394 (green range below). This is preventing the pair from confirming the break above the falling trend line from August. There are warning signs that this resistance area may hold, sending EUR/GBP lower and causing it to resume the dominant downtrend.

EUR/GBP DAILY CHART

EUR/GBP Technical Analysis: Upside Breakout Struggling, May Fail
Zooming in on the EUR/GBP 4-hour chart gives us a closer look at the pair’s struggle to push above resistance. Below, as the pair failed to push above resistance, negative RSI divergence formed. This shows that upside momentum is fading and it may precede a turn lower. In that instance, I am watching a near-term rising support line from November 15th.
A descent through that, followed by another one through the August trend line opens the door to testing Fibonacci extension support levels below. The first is the 38.2% level at 0.87961 which is then followed by the 50% midpoint at 0.87518. Should EUR/GBP overcome resistance instead, the next barrier at 0.89957 (September 21st high) may keep prices at bay.

EUR/GBP 4-HOUR CHART

EUR/GBP Technical Analysis: Upside Breakout Struggling, May Fail

EUR/USD Price Outlook: Euro Threatens Breakout– Levels to Know

  • EUR/USD recovery in focus as weekly opening-range takes shape just below technical resistance
Euro has rallied more than 1.6% against the US Dollar since the yearly / monthly lows with price carving out a well-defined weekly opening-range just below technical resistance. Its decision time for the bulls- here are the updated targets and invalidation levels that matter on the EUR/USD charts. 
EUR/USD DAILY PRICE CHART
EUR/USD Daily Price Chart
Technical Outlook: In our latest EUR/USD Weekly Technical Outlook we noted that Euro had, “responded to long-term support and keeps the focus weighted to the topside while above 1.13.” Price registered a high at 1.1472 yesterday before posting an outside-day reversal candle off slope resistance. Note that Euro has carved a well-defined monthly opening-range and ultimately we’re looking for the break for guidance.
Initial resistance stands at the highlighted trendline confluence, around ~1.1460s with a breach / close above the November opening-range high at 1.15 needed to validate the reversal. Subsequent topside resistance objectives eyed at the 100-Day moving average at ~1.1554 and the 61.8% retracement of the September decline at 1.1586.
EUR/USD 120MIN PRICE CHART
EUR/USD 120min Price Chart
Notes: A closer look at price action shows Euro straddling the weekly open at 1.1413 with the pair trading within an ascending pitchfork formation extending off the October / November lows. Interim support rests at 1.1345/59 with a bullish invalidation now raised 1.1312/14 – this region is defined by the monthly open & the 61.8% retracement of the monthly advance and converges on a sliding parallel of the dominant slope extending off the 11/14 swing lows (area of interest for possible exhaustion / long-entries IF reached).
Bottom line: An outside-day reversal yesterday does cast a bearish tone on price near-term but we’re looking for exhaustion on a move lower for re-entry. From a trading standpoint, I’ll favor fading weakness while above 1.1312 for now with a breach above 1.1516 needed to fuel the next leg higher in price. A break below this formation would shift the focus back towards the yearly lows / low close at 1.1215/18 and the 61.8% retracement down at 1.1187.
EUR/USD TRADER SENTIMENT
EURUSD Trader Sentiment


     RELEVANT EUR/USD DATA RELEASES

EUR/USD Ecnomic Calendar

US Dollar Finds Trend-Line Resistance Following Bounce From Key Support

US DOLLAR SUPPORT BOUNCE RUNS INTO TREND-LINE RESISTANCE

US Dollar Talking Points:
The US Dollar posed a vigorous bounce yesterday after a one-week sell-off followed fresh yearly highs. Support showed at a key area on the chart, and buyers took care of the rest as prices soon jumped up to find resistance on a bearish trend-line connecting the highs of the past week. Tomorrow brings the Thanksgiving holiday in the United States, and even the day after is expected to be low-liquidity across markets as equity exchanges in the US are only open for half of the day, set to close at 1PM ET.
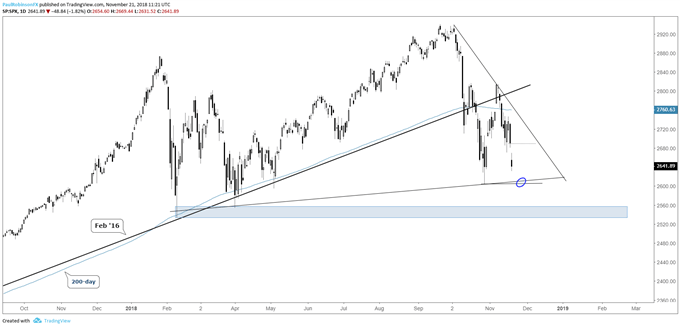
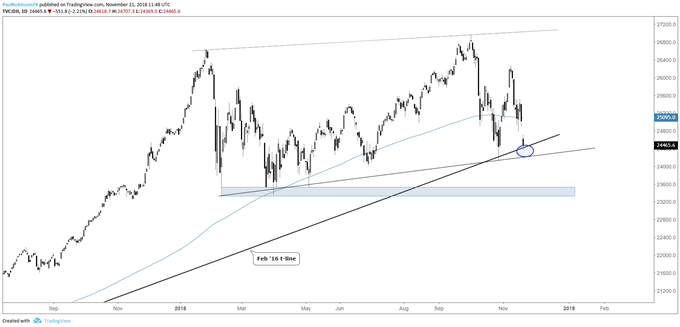
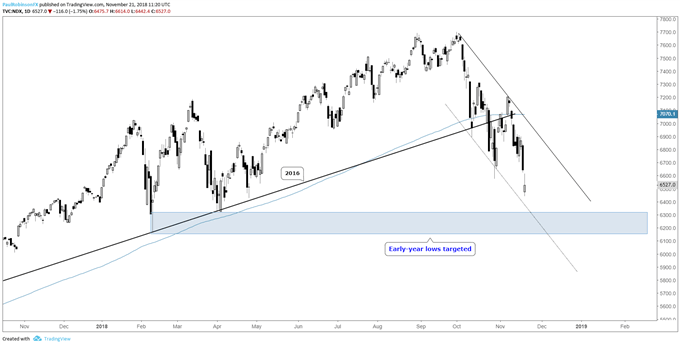
- On that topic of stocks, sellers continued to push yesterday, bringing on fresh November lows in both the S&P 500and the Dow Jones Industrial Average. In the tech-heavy Nasdaq 100, prices fell down to fresh seven-month lows, crossing the October swing as a number of tech names remain in a bearish state.
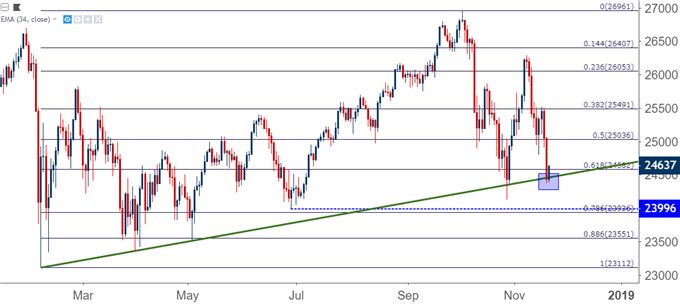
Yesterday was another rough outing for stocks as the Thanksgiving holiday nears, and this was coupled with a surge in the US Dollar after a key area of support came into play yesterday morning. Both the Dow and S&P 500 fell down to fresh November lows while catching support around their respective 2018 trend-line projections. This keeps US indices in a rather vulnerable position as the holiday nears, and even Friday will bring lower levels of liquidity during a partial session, as US exchanges are set to close at 1PM ET on Friday.

DOW JONES DAILY PRICE CHART

DJIA Dow Jones YM Daily Price Chart
US DOLLAR SUPPORT BOUNCE RUNS INTO TREND-LINE RESISTANCE
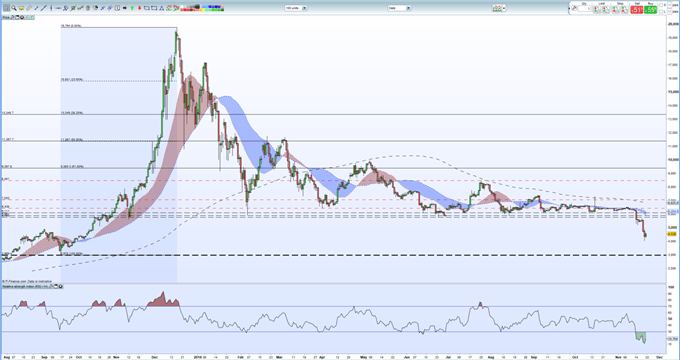
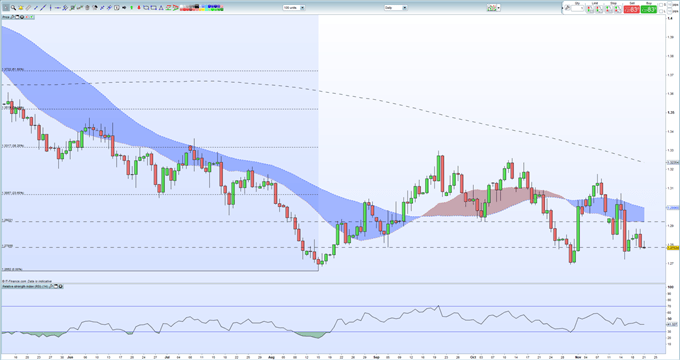
Going along with those equity sell-offs yesterday was a surge in the US Dollar, and this comes after a week of pullback from fresh one-year highs. Last week saw a runaway trend continue in the US Dollar as the currency gapped-up and continued to run, eventually climbing above the 97.50 marker, albeit temporarily. I warned against chasing the move as it appeared that a bull trap was building, and over the next week the US Dollar sank all the way back down towards the 96.00 area on the chart.
As discussed yesterday, this is the 50% marker of the 2017-2018 down-trend in the US Dollar, and this is the same price that helped to set resistance on four separate occasions in October. This appeared to be the big level that finally pulled bulls back into the market, as yesterday’s support test led into a surge of strength in the currency.

US DOLLAR FOUR-HOUR PRICE CHART: SUPPORT BOUNCE FROM PRIOR OCTOBER RESISTANCE

us dollar usd four hour price chart
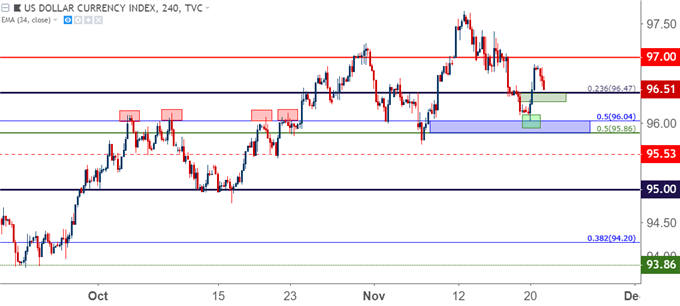
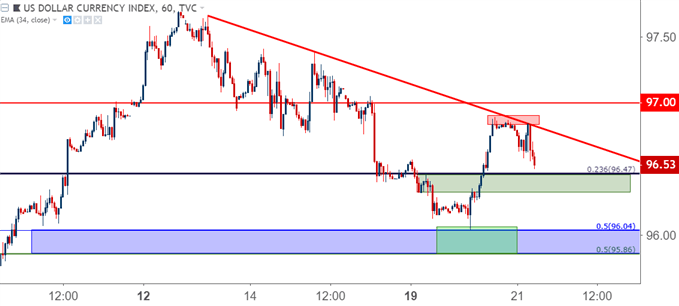
At this point, the US Dollar has run into another technical item, an that’s a bearish trend-line that’s been setting since last week’s pullback began. That resistance has held so far throughout the morning, and this opens the door for another item of support, of which the 96.47 level remains interesting. This is the 23.6% Fibonacci retracement of the 2011-2017 major move in the US Dollar, and a hold of support here would give a higher-low that could open the door for bullish setups in the currency.

US DOLLAR HOURLY PRICE CHART

us dollar hourly price chart usd
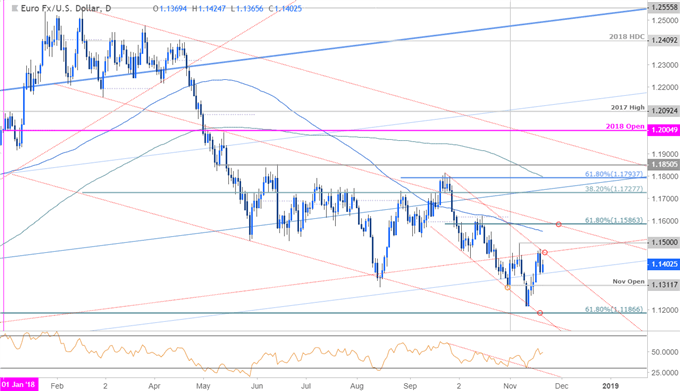
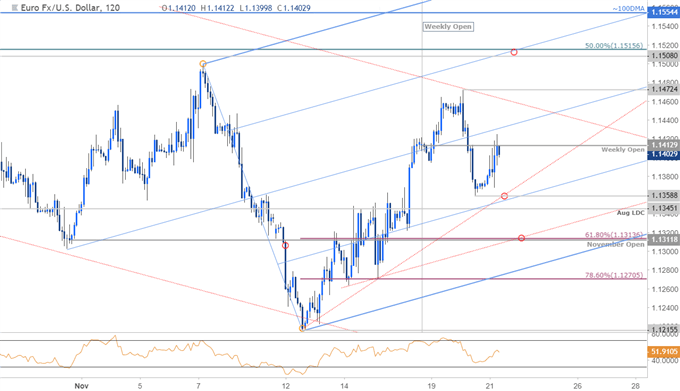
EUR/USD BOUNCES AFTER SELL-OFF FROM RESISTANCE
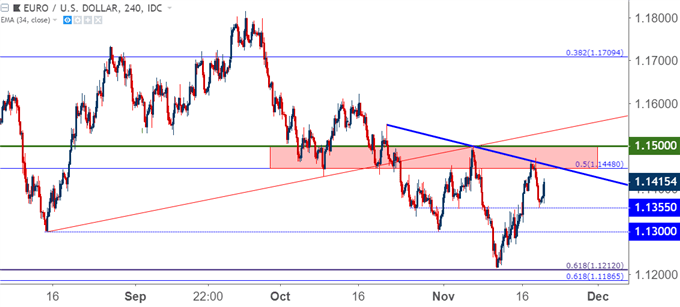
Going along with that surge in US Dollar strength yesterday was a fairly visible drop in EUR/USD after the currency ran into a key resistance zone. This resistance zone runs from 1.1448-1.1500, and this has been in play in EUR/USD since October, when it helped to hold up support for the first portion of the month before soon becoming resistance.

EUR/USD FOUR-HOUR PRICE CHART

eurusd four hour price chart
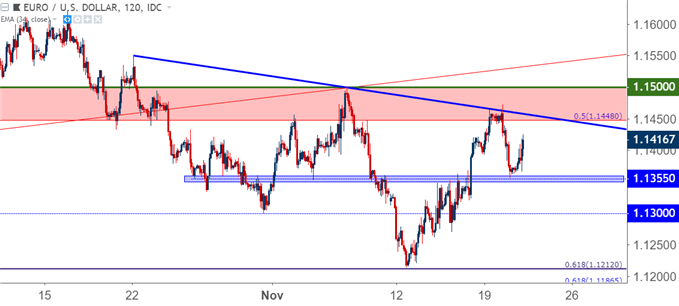
That sell-off ran all the way down to 1.1355, which is a prior area of both support and resistance; and buyers have so far responded to produce a higher-low on short-term charts. This may be pointing to a deeper move of strength and perhaps even another resistance test on the pair. This could make for a difficult backdrop around short-side continuation going into the holiday.

EUR/USD TWO-HOUR PRICE CHART

eurusd eur/usd two hour price chart
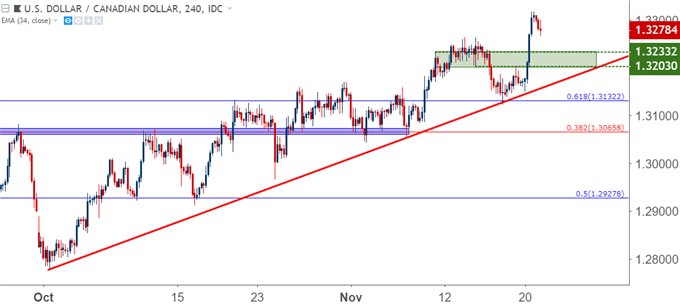
USD/CAD PULLS BACK FROM FRESH FOUR-MONTH HIGHS
USD/CAD was set up fairly interesting coming into this week, as last Friday brought a support test at a key area on the chart. The level of 1.3132 is the 61.8% Fibonacci retracement of the May-September, 2017 move in the pair, and this level lined up fairly well with a bullish trend-line taken from the lows of the past seven weeks. That support test led to a rather vigorous bounce that’s seen prices jump up to fresh four-month highs, and now there’s a bit of a pullback to work with. This keeps the door open for support potential around prior resistance, and given the churn that was seen at that prior area, this is a rather large area. The key would be for buyer support to show above last week’s swing-low in order to keep the door open for bullish continuation strategies.

USD/CAD FOUR-HOUR PRICE CHART: SUPPORT POTENTIAL AROUND PRIOR RESISTANCE

usdcad usd/cad four hour price chart

Bitcoin, Ethereum, Ripple Prices: Cryptocurrencies Lose 25%

BITCOIN, BITCOIN CASH, ETHEREUM, RIPPLE: PRICES, CHARTS AND ANALYSIS

  • Cryptocurrencies fall between 25% and 50%.
  • Overall market capitalization down by nearly USD60 billion.

CRYPTOCURRENCY MARKET – CALM BEFORE (ANOTHER) STORM?

Cryptocurrency market leader Bitcoin (BTC) touched a 14-month low of $,4051 on Tuesday evening before recovering back to around $4,400, but the bounce is unlikley to continue as sellers remain dominant in the market. Support levels on some charts are still a distance away, while other, newer, coins have little previous price action down at these levels. We warned over the last two months that tight markets and low volume can quickly spark a sharp breakout, either way, and the overall technical set-up of most coins – descending triangles – always pointed to lower prices.

BITCOIN DAILY PRICE CHART (AUGUST 2017 – NOVEMBER 21, 2018)

Bitcoin, Ethereum, Ripple Prices: Cryptocurrencies Lose 25%
Investors remain net-long cryptocurrencies but recent changes give us a mixed trading bias – for example the number of traders net-short Bitcoin is up 50% from last week. 

S&P 500, Nasdaq 100 & Dow Charts Have Important Support Levels to Watch

S&P 500/NASDAQ 100/DOW JONES TECHNICAL HIGHLIGHTS:

  • S&P 500 may bounce soon but looking for early-year lows still
  • Dow Jones Feb ’16 & Feb ‘18 trend-lines at hand
  • Nasdaq 100 continues to lead weakness, nearing earlier-year lows
S&P 500 MAY BOUNCE SOON BUT LOOKING FOR EARLY-YEAR LOWS STILL
When I last discussed U.S. indices they were sitting considerably higher, and it was noted that traders should beware of a steep decline even if the worst of the down-move was over. At this time we are presented with at best a double-bottom retest in the S&P 500. However, with the bull market leader, the Nasdaq 100 and its leading group of stocks (‘FAANG’), already having made an important new low, more weakness is expected.
However, a sharp bounce could develop, first, as volatility is expected to remain high for the foreseeable future and support levels are nearby. In conjunction with the October low at 2603 there is a trend-line extending over from February (it’s not the most precise with the connecting candle wicks, but nevertheless it runs in the general vicinity of last month’s low).
First up as resistance on any strength will be the gap from yesterday running up to 2690. Followed by a fill there isn’t any great price resistance for a good ways up and if the market is to trade lower, while a sharp bounce could unfold, it may not make it back to meaningful levels up over 2740 to 2760 or the trend-line off the record high.
A sustained break below the October low will have the Feb/April lows in focus from 2553 down to 2532. This area will be huge for the market and likely to at least spur some short-term buying interest, if not end the decline for a larger recovery.
S&P 500 DAILY CHART (OCTOBER LOW, T-LINE NEAR)
S&P 500 daily chart, October low, t-line near

DOW JONES FEB ’16 & FEB ‘18 TREND-LINES AT HAND

With the Dow having been the strongest of the major indices during these turbulent times it is still holding onto the important Feb ’16 trend-line the S&P 500 broke last month. Also in the vicinity is another t-line from February of his year. The October low at 24122 is in the neighborhood as well. This makes for a strong cross-road. If held, the gap-fill to 25017 is first up as resistance, not far away from the 200-day at 25095. A breakdown will have the earlier-year lows on deck from 23531 down to 23360. There were three bottoms in that zone, making it a huge area of support.

DOW DAILY CHART (OCT, FEB ’16 & 18 T-LINE SUPPORT)

Dow daily chart, Oct, Feb '16 & '18 t-line support at hand

NASDAQ 100 CONTINUES TO LEAD WEAKNESS, NEARING EARLY-YEAR LOWS

The Nasdaq 100 posted a lower-low yesterday and suggests the other two major U.S. indices could soon do the same. The early-year lows are already in sight to be tested from 6322 down to 6164. A bounce from here won’t have any substantial resistance until the trend-line off the record high. Yesterday the gap at 6642 was nearly filled, but not quite.

NASDAQ 100 DAILY CHART (EARLY-YEAR LOWS TARGTED)

Nasdaq 100 daily chart, early-year lows targeted

GBPUSD: Brexit Fears Remain as UK PM May Heads to Brussels

STERLING, BREXIT AND US DOLLAR:

  • Sterling treads water as UK PM Theresa May heads off to Brussels.
  • PM May has rebuffed no confidence vote for now.
STERLING (GBP) VOLATILITY LIKELY TO INCREASE AS BREXIT NEGOTIATIONS CONTINUE
UK PM May will head off to Brussels later Wednesday to meet European Commission head Jean-Claude Juncker to sign-off a political declaration on the future EU/UK relationship. The document, which is not politically binding, will offer a blueprint on the relationship between the EU and the UK, and will cover a wide range of sectors including trade, energy and financial services. The document has already caused problems in the UK and the EU with both sides questioning various areas and commitments. And while PM May will likely come back triumphing the progress, as we stand, this deal is highly unlikely to pass through a House of Commons vote, increasing the risks of a no-deal Brexit, a general election or a second referendum. In all of these cases Sterling volatility will jump higher.
Brexit Chaos Leaves Sterling Still Vulnerable to Whiplash Moves.
GBPUSD currently trades either side of 1.2800 and is waiting for further Brexit details before it makes its next move. The US dollar remains strong for now despite recent Fed rhetoric making investors question the path of future US interest rates hikes, although the December rise is still priced in the market. The US will be on holiday for most of Thursday and Friday this week, lowering liquidity and price action.
GBPUSD remains supported between 1.2695 and 1.2725 ahead of the August 15 multi-month low at 1.2662. To the upside, resistance at 1.2921 and 1.2993 ahead of Fibonacci retracement at 1.3067.
Retail traders remain long of GBPUSD but recent changes give us a strong bearish contrarian trading bias.

GBPUSD DAILY PRICE CHART (MAY – NOVEMBER 21, 2018)

GBPUSD: Brexit Fears Remain as UK PM May Heads to Brussels

Crude Oil Analysis: Bearish Momentum to Continue Despite Short Term Lift


Oil Price Analysis and News
  • Oil Plunge to Prompt Russian Involvement in OPEC Curb
  • API Data Breaks Run of Rising Oil Stockpiles
  • Short Term Gain, Long Term Pain

OIL PLUNGE TO PROMPT RUSSIAN INVOLVEMENT IN OPEC CURB

Oil prices continued its descent with WTI and Brent crude losing as much as 6% in yesterday’s session. Consequently, WTI and Brent crude have dropped 30% and 27% respectively from the peak seen on October 3rd. That said, given the drop in oil prices, it would be hard for Russia to not take part in the expected OPEC led oil production cuts at the Bi-Annual OPEC meeting on December 6th, despite stating that they would take a wait-and-see-approach. Since reports circulated that Russia may not take part in the latest round of production cuts, oil prices have dropped around 6%.
As mentioned yesterday, the oil market is not yet convinced by OPEC’s strategy in believing that it will prevent oversupply, despite talk of a potential cut of up to 1.4mbpd. Russian involvement would be needed to increase its influence in stabilizing the oil market and given the sustained drop in prices, it is likely that Russia will participate. Eyes will be on any jawboning to prop up prices ahead of the meeting.

API DATA BREAKS RUN OF RISING OIL STOCKPILES

A slight reprieve in oil prices this morning with both Brent and WTI clawing back some losses. This has largely stemmed from the surprise drawdown in yesterday’s API inventory report, which showed a 1.5mln barrel drop in stockpiles, against an expected 2.9mln barrel rise. If this is confirmed by the EIA this would end a run of 8 consecutive weekly oil builds and provide a short-term bounce in oil prices. However, this has not changed the overall and sentiment, which will continue to remain weak amid concerns of an oversupplied market in 2019, reflected by both Brent and WTI crude trading in contango. A more notable price recovery would need to the oil forward curve move back into backwardation.

OIL PRICE CHART: DAILY TIME-FRAME (DEC 2015-NOV 2018)

Crude Oil Analysis: Bearish Momentum to Continue Despite Short Term Lift

Tuesday, November 20, 2018

Asian Stocks Wilt Again On Trade Fears, US Durable Goods Up Next

ASIAN STOCKS TALKING POINTS:

  • Equity markets were weaker across the board
  • US falls and seemingly endless fretting about global trade saw to that
  • The US Dollar saw broad if modest gains
Yet more Wall Street weakness made the going tough for Asia Pacific stocks on Wednesday, with trade worries once again to the fore.
The US said on Tuesday that China has failed to alter what Washington terms the “unfair, unreasonable” practices at the heart of the current trade spat between the two global titans. This finding was part of the US Trade Representative’s investigation into China’s intellectual property practices.
Leading US indexes fell sharply again on Tuesday too, with the so-called FAANG tech giants in bear-market territory (they are Facebook, Amazon, Apple, Netflix and Google parent Alphabet).
Local stocks followed them down, with the Nikkei 225 off 0.3%, the Shanghai Composite and Hang Seng both down by 0.2%. Australia’s ASX 200 shed 0.5%, with retail names under some pressure. Seoul’s Kospi was in the red by a similar amount as its close loomed.
The Nikkei has fallen very sharply from the multi-year highs of early October.
Important Support Nears. Nikkei 225, Daily Chart
However, it remains for the moment above a key range of daily-chart support between October’s lows and those of March, 2018 which are also the lows for the year. Unless the bulls can hold the market at the former, the latter may well come quickly into focus for the broader market.
With those trade and growth worries in prospect, it should be no surprise that perceived haven currencies rose in Wednesday’s trade. The US Dollar seemed to get the best of it, edging higher against its major traded rivals. USD/JPY rose once again, with the bout of Yen strength seen earlier this month petering out a little. While both currencies have the apparently requisite haven stats, the greenback continues to offer considerable yield advantage over its Japanese peer.
Gold prices crept lower, not an uncommon sight as the Dollar gains. Crude oil prices recovered somewhat from their recent slump but the market remains very skittish as investors try to form a view about likely medium-term demand.
Still awaiting investors on Wednesday’s schedule are the economic outlook from the Organization for Economic Cooperation and Development, UK public spending figures and the University of Michigan’s sentiment snapshot. However all these are likely to be mere bit players to the main event- October’s US durable goods order numbers. Jobless claim data and crude oil inventory figures are due too.

AUD/JPY Price Outlook: Reversal Run Plummets into Key Support Zone

  • AUD/JPY reversal from technical resistance targeting key near-term inflection zone
The Japanese Yen has rallied nearly 2% against the Australian Dollar as AUD/JPY reversed from confluence resistance earlier in the month. The pullback is now targeting a key support confluence / inflection zone just lower - here are the updated targets and invalidation levels that matter on the AUD/JPY charts. 
AUD/JPY DAILY PRICE CHART
AUD/JPY Daily Price Chart
Technical Outlook: In my latest AUD/JPY Weekly Technical Perspective we highlighted a critical resistance confluence at 83.00/05 with the immediate long-bias vulnerable while below this threshold. An ascending pitchfork extending off the October lows further highlights this key resistance range. A break below the median-line today in New York trade is now approaching the first major support zone at 81.23/34 - this region is defined by the 38.2% retracement of the advance off the yearly low, the 100-day moving average and the 100% extension of the decline off the monthly high. This region represents a key inflection zone in price and we’re looking for a reaction here today.

AUD/JPY 240MIN PRICE CHART

Please add a description for the image.
Notes: A closer look at price action shows AUD/JPY breaking below the October trendline early in the week with the decline now approaching confluence support at 81.23/34- looking for a reaction here. If this pullback is a simple correction, price would need to stabilize above this threshold into the close. A break below would expose the June low / lower parallel at 80.63 with the 61.8% retracement just lower at 80.28- both areas of interest for exhaustion / long-entries IF reached.
Initial resistance now stands back at the median-line backed by the weekly open at 82.40. Near-term bearish invalidation stands with the high-day close at 82.75- a breach / close above this threshold would shift the focus back towards topside objectives at 83.05 and 83.26.
Bottom line: AUD/JPY is approaching a key near-term inflection zone at 81.22/34- with the broader outlook still weighted to the topside while within this formation. From a trading standpoint immediate risk is for a slip lower but we’re looking to fade weakness into these support targets with a breach above 82.75 needed to mark resumption towards the upper parallels.

AUD/JPY TRADER SENTIMENT

AUD/JPY Trader Sentiment

RELEVANT AUD/JPY DATA RELEASES

AUD/JPY Economic Calendar