fundamental analysis: February 2019

Friday, February 22, 2019

US Dollar Bounce at Support Keeps Near-term Outlook ’Neutral’

Talking Points
- EU officials continue to insist that no changes can be made to the Withdrawal Agreement, but it is possible for a three-month extension of the Brexit window into the end of June.
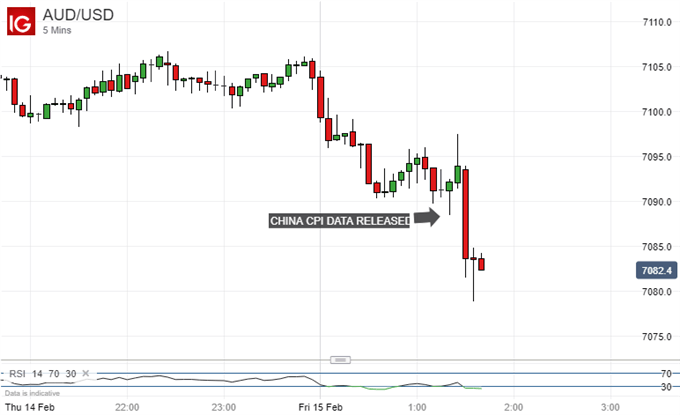
- American and Chinese trade negotiators aren’t expected to reach a major breakthrough, but the March deadline for the bump in tariffs could be avoided anyway.
The US Dollar (via the DXY Index) has seen its losses halted following doji candles that appeared midweek, although gains are proving difficult to hold onto. Meaningful US economic data have been few and far between this week, but those data that did arrive have showed that the US economy may have indeed lost momentum early in Q1’19 (perhaps due to the government shutdown). Otherwise, traders continue to grapple with the implications of the January FOMC meeting minutes.

BREXIT EXTENSION AROUND THE CORNER?

Across the pond, the EU-UK Brexit negotiations remain at an impasse, with the UK government looking for additional assurances regarding the Irish border backstop and the EU saying that the Withdrawal Agreement can’t be renegotiated. This game of chicken is likely to continue as neither side wants to see the UK crash out of the EU without a deal. Accordingly, we’ve now arrived at the juncture where officials on both sides are openly talking about a three-month extension to the negotiation window beyond March 29.
This is not a surprise. As we’ve explained before, an extension to the negotiation window was a distinct possibility, as was the duration of the extension. Why? In early-July 2019, new MEPs will be elected. It makes sense, from the EU’s perspective, to cleave the relationship with the UK beforehand. Otherwise, if the UK is able to send MEPs to the new European Parliament, it’s not much of a Brexit at all, is it?

US-CHINA TRADE TALKS MAY NOT PRODUCE MUCH

Chinese Vice Premier Liu Hi is in Washington, D.C. meeting with US Treasury Secretary Steve Mnuchin and US Trade Representative Robert Lighthizer for a seventh round of trade talks in order to avoid the not “magical” (US President Trump’s words) March 1 deadline for a deal. Otherwise, without a deal, the 10% tariff on $200 billion of imported Chinese goods will evolve into a 25% tariff on March 2.
Early signs from the talks indicate that not much progress is being made. But what little that is being accomplished may simply be laying the ground work to push off the implementation of the higher tariffs on March 2, rather than a sincere effort at resolving the problems in totality. After all, a summit between US President Trump and Chinese President Xi Jingping is required before a deal can be signed, sealed, and delivered – and no summit date has been set yet.

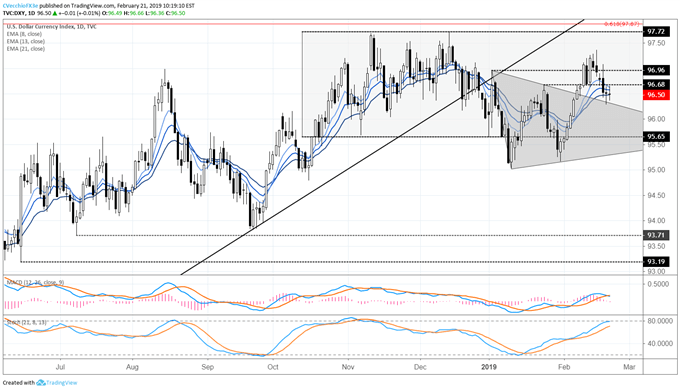
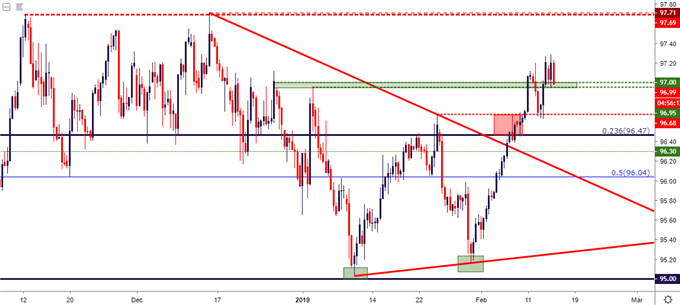
DXY INDEX PRICE CHART: DAILY TIMEFRAME (JUNE 2018 TO FEBRUARY 2019) (CHART 1)

US Dollar Bounce at Support Keeps Near-term Outlook 'Neutral'
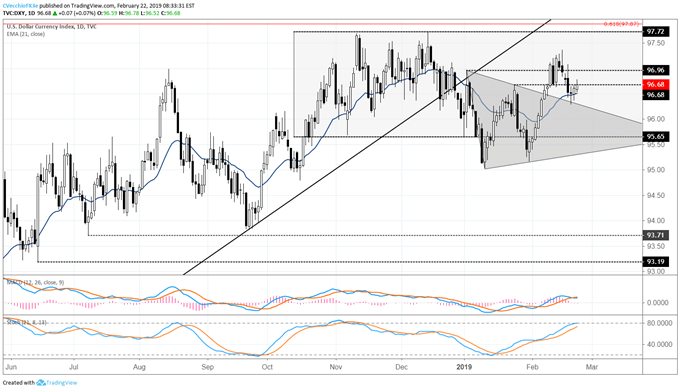
When we commented on the DXY Index technical situation yesterday, price was in the midst of forming an inside day doji candle – a second consecutive doji candle at that. Coming off of a selloff from Friday’s high (as well as the yearly high), the implication was that the near-term outlook was neutral. By the end of the day yesterday, the inside day doji had become an inside day hammer – raising the odds of a near-term low having been established.
In what doesn’t appear to be a coincidence, this week’s lows come back at the retest of the symmetrical triangle resistance, now support in the breakout attempt. To this end, the daily 21-EMA, despite being test, held up on a closing basis as support as well. It thus still holds that a return back into the symmetrical triangle (below 96.30 by the end of this week) is necessary to constitute a shift to a fully bearish point of view in the short-term

Gold Price Consolidates Further, Chart Remains Positive

GOLD (XAU) PRICE, NEWS AND CHART:

  • Gold slips as market grab a risk-on bid.
  • Higher highs and lows dominate the Gold chart.
Gold’s sell-off from Wednesday’s 10-month high remains intact as financial markets continue to trade with a risk-on bias, boosted by US-China trade hopes, while a resilient US dollar weighs on the precious metal. The mid-week sell-off may have room to extend further but the Gold chart remains positive and is likely to find support shortly before it prepares to make a fresh attempt at the January 2018 high at $1,366/oz.
Gold is currently heading towards its weekly low around $1,320/oz. although today’s price action is muted. The medium-term outlook for Gold remains positive with a series of higher highs and higher lows confirming the upward trend. The RSI indicator has reversed out of overbought territory, as it has done twice before this year, but sentiment remains positive. Below this week’s low, the 20-day moving average may provide support around $1,318/oz. ahead of the current monthly low around $1,302/oz. If the pattern of moving higher, becoming overbought and then consolidating repeats itself for a third time this year, the latest downturn in the precious metal may prove to be short-lived.
GOLD DAILY PRICE CHART (MAY 2018 – FEBRUARY 22, 2019)
Gold Price Consolidates Further, Chart Remains Positive

Thursday, February 21, 2019

US Dollar Selloff Hits Pause as Back-to-Back Dojis Materialize

Talking Points
- The US-China trade negotiations are front-and-center once more, with Chinese Vice Premier Liu He in Washington, D.C. to meet with US Treasury Secretary Steve Mnuchin and US Trade Representative Robert Lighthizer.
The calamity unfolding in UK parliament may actually be the reason why the British Pound is staying afloat.
The US Dollar (via the DXY Index) is treading water for the second straight day, with traders lacking concrete catalysts in the near-term to help divine the next major move. Back-to-back dojis on the daily chart speak to this state of indecision, and the lack of significant economic developments out of the United States this week may be contributing to the state of trance. The greenback appears to be waiting to take cues from other asset classes, as both US equtiy markets and Gold prices are pulling back after their recent extended rallies.
Brexit Latest – Defections Help Buoy Sterling
As the February 26 (UK parliament takes control) and March 29 (UK leaves EU) deadlines approach, the growing number of departures from both the Labour and Tory parties into a new, pro-Remain political party, “The Independent Group,” is a sign that a no deal, “hard Brexit” might be avoided. After all, UK PM Theresa May’s hold on power is proving increasingly tenuous, now that her majority in parliament is down to a skinny eight votes. Paradoxically, the more defections that take place, the greater the likelihood that the UK will have to push back its Brexit deadline and pursue other options, like a general election or second refernedum, instead.
Seventh Round of US-China Trade Talks Begin
The economic calendar has been quiet this week for the US, outside of a few housing market releases and the January FOMC meeting minutes. Stepping into this void is the next round of US-China trade war negotiations taking place in Washington, D.C. Chinese Vice Premier Liu Hi is meeting with US Treasury Secretary Steve Mnuchin and US Trade Representative Robert Lighthizer, and it’s possible that the groundwork is being laid to avoid the early-March deadline.
After all, US President Donald Trump said that the deadline wasn’t “magical,” raising hopes that the negotiation window could be extended without the trade war intensifying. Otherwise, without a deal, the 10% tariff on $200 billion of imported Chinese goods will evolve into a 25% tariff on March 2.
DXY Index Price Chart: Daily Timeframe (June 2018 to February 2019) (Chart 1)
US Dollar Selloff Hits Pause as Back-to-Back Dojis Materialize
After seeing bearish outside engulfing bars develop between last Friday and Tuesday, any near-term bullish view was negated earlier this week. There’s little reason thus far to think that the near-term outlook is anything other than neutral at present time. A doji candle yesterday hinted at the state of indecision, and the inside day doji forming today compounds the state of turbidity. It thus still holds that a return back into the symmetrical triangle (below 96.30 by the end of this week) is necessary to constitute a shift to a fully bearish point of view in the short-term.

USD Dented, AUD Slammed on China Tensions - US Market Open

MARKET DEVELOPMENT – USD Dented, AUD Slammed on China Tensions
USD: The greenback is marginally softer across the board with exception of AUD and NZD, following the latest Philly Fed data, in which the business outlook fell to its lowest level since the May 2016. Consequently, this poses downside risks to next months ISM Manufacturing reading, while also confirming that the US economy is indeed beginning to feel the spill-over effects from the slowdown observed in the rest of the world.
GBP: A relatively choppy session for the Pound thus far amid a serious of conflicting Brexit headlines. GBPUSD had initially dipped on reports citing a UK Official that a Brexit deal next week is unlikely. However, GBP quickly pared the initial decline after EU Diplomats sources noted that they were moving towards breaking Brexit impasse. GBPUSD currently hovering around its best levels of the day and comfortably above the 200DMA at 1.3050.
AUD: The Australian Dollar fell over 1% overnight after China stated that ports will ban imports of Australian coal amid the rising geopolitical tensions between China and Australia. Further losses had been stemmed with AUDUSD holding 0.71 . Of note, coal is currently Australia’s most valuable export, in which China consumes roughly 25% of their coal exports.
USD Dented, AUD Slammed on China Tensions - US Market Open
Economic Calendar– North American Releases
USD Dented, AUD Slammed on China Tensions - US Market Open


AUD Technical Analysis Overview: AUDUSD, AUDJPY, AUDNZD

AUD Analysis and Talking Points
  • AUDUSD | Near-term Stabilisation as 0.71 Holds
  • AUDJPY | Topside Resistance Holds, Outlook Remains Bearish
  • AUDNZD | Key Support Keeps Cross Afloat
AUDUSD | NEAR-TERM STABILISATION AS 0.71 HOLDS
AUDUSD failed to make a convincing break above the descending trendline yet again. The pair currently holding the 0.7100 handle after a somewhat excessive move to the downside. Key support situated at the 0.7067, which marks the 23.6% Fibo level. Momentum indicators remain bearish; however, this has eased in recent sessions, which in turn could see slight stabilisation in the near-term. On the topside, resistance is at 0.7180-0.7200.

AUDUSD PRICE CHART: DAILY TIME FRAME (SEP 2018 – FEB 2019)

AUD Technical Analysis Overview: AUDUSD, AUDJPY, AUDNZD

AUDJPY | TOPSIDE RESISTANCE HOLDS, OUTLOOK REMAINS BEARISH

AUDJPY remains bearish below 80.00, overnight saw topside resistance at 79.80 hold firm. Momentum indicators continue to point to a bearish outlook. Eyes now on support situated at 78.40-50, whereby a firm break below could open up a move towards 78.00.

AUDJPY PRICE CHART: DAILY TIME FRAME (OCT 2018– FEB 2019)

AUD Technical Analysis Overview: AUDUSD, AUDJPY, AUDNZD

AUDNZD | KEY SUPPORT KEEPS CROSS AFLOAT

Key support at the 1.04 handle continues curb AUDNZD from further losses, alongside this, bearish momentum indicators have notably eased over the past week suggesting that the cross may have based out around 1.0370. As such, there is increased scope for a move to the upside with the 50dma at 1.05 in focus.

AUDNZD PRICE CHART: DAILY TIME FRAME (JUN 2018 – FEB 2019)

AUD Technical Analysis Overview: AUDUSD, AUDJPY, AUDNZD

Wednesday, February 20, 2019

Nikkei 225 Technical Analysis: Mature Uptrend Holds Into New Range

NIKKEI 225 TECHNICAL ANALYSIS TALKING POINTS:

  • The Nikkei’s daily uptrend channel looks solid
  • Its rise into a new trading band is perhaps rather less so
  • Still, there’s reason to hope for more upside yet
The Nikkei 225 remains very much in the broad uptrend which has characterized trade on the daily chart since late December.
Uptrend holds on: Nikkei 225, Daily Chart
Indeed, that uptrend took another leg higher in the past week, breaking conclusively into a new trading range. That range is in turn marked by the top of the sharp fall which floored the index and, it should be noted, many of its global peers between mid and late December.
The peak of that range comes in at 21,943.8 and that is probably the bulls’ most important near-term upside target. Even if they can’t get there, consolidation within this range-rather than a retreat below it- will probably be seen as quite a bullish sign.
If the index can hold on at this altitude then November 30’s peak at 22.779 will be the medium-term target, although the index does look a little overbought at current levels and a rest will probably be needed before we can see any sort of durable attempt at that peak.
As for the downside, channel support comes in around the 20,409 level. That’s quite a way below the market and I don’t expect a near-term test of that unless global risk appetite takes quite a knock. Further up there’s probable support at 20,840. That’s where the first, 23.6% Fibonacci retracement of the current climb comes in.
A retest of even that would mean that the new trading range had been abandoned to the downside, however, and a lack of consolidation around that level might presage more falls.

Upbeat Australia Employment Report to Fuel AUD/USD Rate Recovery

TRADING THE NEWS: AUSTRALIA EMPLOYMENT CHANGE

Updates to Australia’s Employment report may curb the AUD/USD pullback following the Federal Open Market Committee (FOMC) Minutes as the economy is expected to add another 15.0K jobs in January.
Image of DailyFX economic calendar
Signs of a more robust labor market may heighten the appeal of the Australian dollar as it boosts the outlook for growth and inflation, and the Reserve Bank of Australia (RBA) may have a difficult time defending the wait-and-see approach for monetary policy as ‘growth was expected to be a little above trend over the forecast period.’
In turn, a headline print of 15.0K or great may spark a bullish reaction in AUD/USD as it puts pressure on the RBA to lift the official cash rate (OCR) off of the record-low, but a dismal development may curb the recent appreciation in the Australian dollar as Governor Philip Lowe & Co. warn that there aresignificant uncertainties around the forecasts, with scenarios where an increase in the cash rate would be appropriate at some point and other scenarios where a decrease in the cash rate would be appropriate.
IMPACT THAT AUSTRALIA EMPLOYMENT REPORT HAD ON AUD/USD DURING THE LAST RELEASE
Period
Data Released
Estimate
Actual
Pips Change
(1 Hour post event )
Pips Change
(End of Day post event)
DEC
2018
01/24/2019 00:30:00 GMT
18.0K
21.6K
+18
-53
December 201Australia Employment Change
AUD/USD 5-Minute Chart
Image of audusd 5-minute chart
Fresh figures coming out of Australia showed the economy adding 21.6K jobs in December following a 39.0K expansion the month prior, while the Unemployment Rate unexpectedly narrowed to 5.0% from 5.1% during the same period as the Participation Rate slipped to 65.6% from 65.7% in November. A deeper look at the report showed part-time employment increasing 24.6K in December to lead the advance, while full-time positions slipped another 3.0K following a 7.3K contraction the month prior.
The Australian dollar nudged higher following the better-than-expected print, but the reaction was short-lived, with the aussie-dollar exchange rate slipping back below the 0.7100 handle to close the day at 0.7090. 
AUD/USD DAILY CHART
Image of audusd daily chart
  • Keep in mind, the broader outlook for AUD/USD remains tilted to the downside as the flash-crashrebound stalls at the 200-Day SMA (0.7276), with both price and the Relative Strength Index (RSI) failing to preserve the bullish formations from earlier this year.
  • However, it seems as though AUD/USD will continue to hold above the psychologically important 0.7000 handle as it reverses course ahead of the 0.7020 (50% expansion) hurdle, with advance from the monthly-low (0.7054) bring the 0.7170 (23.6% expansion) to 0.7180 (61.8% retracement) region back on the radar.
  • Need a break/close above the Fibonacci overlap to open up the 0.7230 (61.8% expansion) area, with the next region of interest coming in around 0.7320 (50% expansion) to 0.7340 (61.8% retracement).

GBPUSD: Cable Pulls Back From Fibonacci Resistance After FOMC Minutes

GBPUSD TALKING POINTS:

GBPUSD is softening after a strong four-day push, with resistance showing at the 14.4% retracement of the January bullish trend. Aiding in that pullback is US Dollar strength being driven from today’s release of FOMC meeting minutes from the January rate decision.
- Brexit remains a difficult driver to work with and the prospect of longer-term trend substantiation can remain as a challenge around GBP-pairs in the near-term. But, given the volatility that’s continued to show around the currency, the door can remain open for short-term strategies utilizing support and resistance levels in order to reinforce strong risk-reward ratios.
GBPUSD BACKTRACKS AFTER TESTING FIBONACCI RESISTANCE
The British Pound is pulling back after testing above the 1.3100 level earlier this morning. This capped a strong topside run that showed up after the print of a fresh low less than a week ago. The month of January brought a stretch of strength into GBPUSD that likely caught many by surprise, especially considering the way that the year started for the pair: GBPUSD put in a rather large drop on January 3rd, slipping below 1.2500 temporarily as bears made a push. But the rest of January was marked by recovery, as GBPUSD climbed back above the 1.3000 psychological level to test above 1.3200.
As looked at last week, prices began soften from that bullish theme in the final week of January. And that pullback ran for more than a couple of weeks as GBPUSD tested below the 50% marker of the January bullish run. But since then, buyers have made a pronounced entrance back into the equation, particularly over the past two days of price action, helping to firm prices back above the 1.3000-handle.

GBPUSD FOUR-HOUR PRICE CHART

gbpusd gbp/usd four hour price chart

At this point, prices have vaulted into another area of potential resistance, as the space between 1.3106-1.3117 has two different Fibonacci levels of interest. The 1.3106 level is the 14.4% retracement of the January bullish move, while 1.3117 is a longer-term level as the 38.2% marker of the ‘Brexit move’ in the pair.

GBPUSD HOURLY PRICE CHART

gbpusd gbp/usd hourly price chart
GBPUSD STRATEGY
As discussed over the past few weeks, traders will likely want to continue to limit strategy around GBP-pairs to shorter-term variants, as the volatile nature of the backdrop around the British Pound can continue to evoke turns in either direction. Short-term strategies utilizing support and resistance levels to reinforce advantageous risk-reward ratios appears to be a prudent way of approaching matters in the near-term.
On the below hourly chart are a number of potential levels on either side of current price. For resistance, the zone that’s eliciting the current reaction remains relevant and that rests from 1.3106-1.3117. A bit higher at 1.3160 is the January 31st swing-high, and above this is the 2019 high at the 1.3218 marker that came into play a few weeks ago. For support, the next area of focus is 1.3000-1.3034, which helped to hold the lows earlier this morning. Below that is a zone that runs from 1.2893-1.2920, which currently marks this week’s swing low; and underneath that area is the same 1.2828-1.2850 area that was looked at last week.

GBPUSD HOURLY PRICE CHART

gbpusd gbp/usd hourly price chart

Friday, February 15, 2019

Gold Price Analysis: Trump Mulls Emergency Action, YTD Highs in Focus

Gold Price Analysis and Talking Points:
  • Gold May See YTD Highs as Trump Takes Emergency Action
  • Fundamental Support Remains Amid Strong Central Bank Buying

GOLD MAY SEE YTD HIGHS AS TRUMP TAKES EMERGENCY ACTION

As investors continue to ponder growing downside risks, gold prices remain elevated. Following the worst US retail sales figures in a decade, the precious metal saw its largest intra-day gain in 2-weeks. A potential catalyst that could see the gold reach its YTD peak ($1326) is President Trump’s remarks on the border from 1500GMT. While another government shutdown looks to be avoided after the US Senate and House passed the government funding and border security bill, with the agreement now sent to Trump to sign. The President has indicated that he will declare a national emergency, allowing for $8bln to be dedicated to the wall, which is not only above the $1.4bln in the border security bill but also above the initial demand of $5.7bln. In calling a national emergency, political risks may begin to way on risk sentiment thus providing safe haven flows for gold.

FUNDAMENTAL SUPPORT REMAINS AMID STRONG CENTRAL BANK BUYING

Among the fundamental drivers of the upside in gold has been through last years central bank buying spree, which may continue throughout 2019. After a 2yr hiatus, the PBoC have shown gold reserves rose for a second consecutive month to 59.94mln ounces, further reinforcing the viewpoint that gold buying is to remain prominent amid the waning global growth outlook.
Gold Price Analysis: Trump Mulls Emergency Action, YTD Highs in Focus
Source: Refinitiv, Chinese Gold Reserves.
GOLD PRICE CHART: DAILY TIME-FRAME (MAR 2018-FEB 2019)
Gold Price Analysis: Trump Mulls Emergency Action, YTD Highs in Focus
Resistance is situated at the YTD high ($1326), whereby a break above could see a move towards $1350. Near-term support sits at the psychological $1300 level, while $1280 also remains key to maintain the uptrend.

Thursday, February 14, 2019

Australian Dollar Slips As Chinese Inflation Underwhelms Again

AUSTRALIAN DOLLAR, CHINA CPI TALKING POINTS:

  • Chinese Consumer and Producer Price Indexes missed forecasts
  • The trend towards softer Chinese numbers clearly endures
  • The Australian Dollar wilted just afterward, even though this weakness may portend more stimulus
The Australian Dollar faded a little Friday on news of more economic weakness out of China, this time in the form of inflation data.
The official Consumer Price Index rose by 1.7% on the year, below the 1.9% expected. Producer prices added just 0.1%, even worse than the 0.3% forecast. This feeble outturn will cast fresh doubt on industrial profitability.
The Australian currency often acts as the markets’ favorite liquid China proxy thanks to its home nation’s huge economic ties to the world’s second-largest economy. It seems to have done so Friday, albeit to a limited extent, with a slip seen in the aftermath of the Chinese data.
Australian Dollar Vs US Dollar, 5-Minute Chart
This seems to have been a move lower on the face-value point that weaker inflation flags broader economic problems. But investors may be ignoring the possibility that what it could mean in the end is more stimulus from Beijing. That usually sees the Aussie catch a bid.
Still, it is possible that the Chinese Lunar New Year break will distort figures in the early part of the year, but the initial market reaction would seem to indicate that worries about the Chinese economy do run quite deep in this market now.
Even allowing for this slip, the Australian Dollar has certainly had a calmer week this week after the hiding it suffered last. That came in turn as the Reserve Bank of Australia announced what amounted to a turnaround in interest rate guidance. It said that the record-low Official Cash Rate could yet go lower, when previously it had suggested that a rise was the most likely next move. The central bank also revised its growth and inflation forecasts sharply lower.
Still, global risk appetite has held up quite well as investors look with hope to trade talks between the US and China- a settlement here is probably the key risk to the bearish-China trade. These hopes remain fragile, of course, but they have also supported the growth-sensitive Aussie and kept it above the downtrend channel which dominated last year’s trade.
Australian Dollar Slips As Chinese Inflation Underwhelms Again
Still, reprieve may only be temporary for Australian Dollar bulls. That complete lack of interest rate support is bound to act as a considerable brake on any upward forays.

Price Action Setups in EURUSD, USDCHF and the US Dollar

PRICE ACTION SETUPS IN EURUSD, USDCHF AND THE US DOLLAR

The US Dollar is continuing to face resistance around the 97.20-97.30 area on the charts, coming in after fresh 2019 highs were set earlier this morning. The current pullback has found follow-through support around the prior resistance point at the 97.00 level; but given the inability of buyers to push above 97.30, a deeper retracement may soon show to re-test supports at 96.68, 96.47, or perhaps even 96.30. This could be used to support reversal setups for USD-bears; and for those looking on the long side of the American currency, there could be areas of interest on that theme, as well. In this webinar, I looked at a series of setups across major currency pairs, then moving on to markets such as EUR/JPY,

FOREX TALKING POINTS:

- If you’re looking to improve your trading approach, our Traits of Successful Traders research could help. This is based on research derived from actual results from real traders, and this is available to any trader completely free-of-charge.

US DOLLAR: SHORT-TERM TOPPING POTENTIAL AS RESISTANCE HOLDS 97.20-97.28

The post-FOMC bullish run in the US Dollar has continued through this week, and the Tuesday pullback was left as relatively shallow: Buyers returned at the 96.68 area of prior resistance and pushed right back up to fresh highs. But once prices got there, bulls appeared to lose motivation, and prices soon scaled-back for a re-test of the 97.00 area of prior resistance. After another trip to resistance and then back down to support, it looks increasingly as if Dollar-bulls may need more of a pause before the theme of strength might be ready for continuation.
On the support side of the US Dollar, 96.68, 96.47 and 96.30 all remain of interest for bullish plays. On the resistance side of the matter, 97.70 looms large, as the Double Top formation from November/December peaked out around that area.

US DOLLAR EIGHT HOUR PRICE CHART

us dollar usd eight hour price chart
EURUSD HOLDS RANGE SUPPORT, SHORT-TERM BOTTOMING POTENTIAL
EURUSD continues to hold support in the longer-term range that’s been present over the past few months. This can keep the door open for bullish strategies in the pair for those looking at short-USD exposure, looking for prices to revert to the resistance side of that range; and that exists from 1.1448-1.1500.

EURUSD EIGHT-HOUR PRICE CHART

eurusd eurusd eight hour price chart
On a shorter-term basis, the big question in EURUSD is whether a low forms off of the 1.1250 psychological level. Higher-highs and lows have been showing since that price came into play in the overnight session.

EURUSD 30-MINUTE PRICE CHART: 1.1250 SUPPORT

eurusd eur/usd 30m price chart
GBPUSD SLIDES BELOW 1.2828, NEXT SUPPORT IN VIEW
GBPUSD finally broke-below the 1.2828 marker after finding support there earlier in the week. At this point, traders will likely continue to face challenges on the driver-side of the matter as Brexit remains a rather messy situation. This means that traders would likely want to limit the amount of time exposed to shifts in that theme, instead favoring short-term strategies with swing trades off of support and/or resistance levels.
In GBP/USD at the moment, the big zone of longer-term support lurks from 1.2671-1.2735; and that prior support level of 1.2828 could remain as potential resistance.

GBPUSD TWO-HOUR PRICE CHART

gbpusd two hour price chart
USDCAD TOUCHES ABOVE 1.3325 RESISTANCE
The theme of weakness in USDCAD took a backseat today when CAD weakness propelled USDCAD above 1.3325, albeit temporarily. For those looking at short-side scenarios in the pair, a hold below 1.3361-1.3385 can keep the door open on that theme. For those looking at strength strategies in the pair, shorter-term timeframes can highlight the build of higher-highs and higher-lows.

USDCAD FOUR-HOUR PRICE CHART

usdcad usd/cad four hour price chart
USDJPY PULLS BACK FROM 111.00
On the long side of the US Dollar, USDJPY has been interesting this week as the pair broke-out to a fresh 2019 high. That move continued, even through the Tuesday pullback, and fresh highs were established above the 111.00 handle in the overnight session. But, as discussed earlier this morning, the issue is the lack of continuation: Meaning that a pullback may be in order before that bullish theme is ready for continuation. Support potential could be looked for at 110.31, or that prior area of resistance that runs from 109.67-110.00.

USDJPY FOUR-HOUR PRICE CHART

usdjpy usd/jpy four hour price chart
USDCHF REVERSAL THEMES NEARING?
As US Dollar strength has taken over this year, USDCHF saw a clean topside move that propelled prices back above the parity handle. And so far this week, a resistance level of note has come into play around 1.0096, which is the 78.6% Fibonacci retracement of the December 2016 – February 2018 major move. After thwarting bullish advances on both Wednesday and Thursday of this week, it appears that bears are pushing a bit-lower on the chart, highlighting the possibility of reversal in the pair.

USDCHF EIGHT-HOUR PRICE CHART

usdchf usd/chf eight hour price chart
AUDUSD: BETWEEN A ROCK AND A HARD PLACE
AUDUSD price action over the past couple of days has been fairly quiet, with indecision showing along with prices bound between recent support of .7075 and resistance at .7125-.7150. As discussed in the webinar, if having to choose a bias, the long side may be attractive simply given the proximity to the .7000 big figure, which has helped to elicit support over a few different instances in the recent past. But, traders are going to likely want to let price show more of a directional component before looking to implement such.

AUDUSD FOUR-HOUR PRICE CHART

audusd four hour price chart
NZDUSD: NEARING RESISTANCE
This week’s RBNZ rate decision helped NZDUSD rally off of a key support level at .6717, and prices have pushed back up to .6850. But of note is the series of lower-highs that have printed on longer-term charts dating back to last year. Will buyers be able to take out the February high around .6940? If not, the door may soon open for reversal strategies in the pair.

NZDUSD DAILY PRICE CHART

nzdusd nzd/usd price chart