COT HIGHLIGHTS:
- NZD speculators made a strong shift into long territory
- Euro specs covered for second week in a row, but remain firmly bearish
- Large speculator profiles for other major currencies/markets
Last week’s CoT report brought with it an unusual showing by speculators in the New Zealand Dollar as they covered their short aggressively and turned net-long. Euro speculators covered for a second week in a row amidst choppy trading conditions, but this group of trend-followers remain firmly in the bear camp. Crude oiltraders made a very small change to their positioning, however; that was before the major damage was done for the week. We will have to revisit oil trading activity next week.
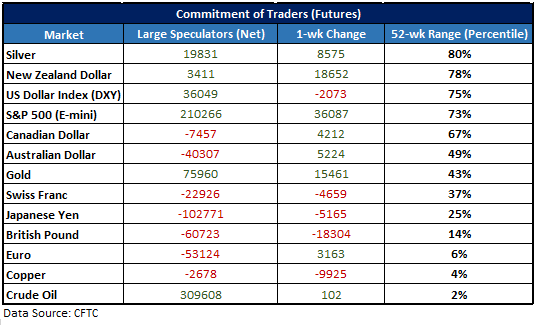
On Fridays the CFTC releases a detailed report of traders’ positioning in the futures market as reported for the week ending on Tuesday. Outlined in the table below are key stats concerning the positioning of large speculators (i.e. hedge funds, CTAs, etc.), excluding small speculators and commercial traders.
‘Large specs’ are known to typically employ trend-following strategies, and as such, they tend to add to long positions and reduce shorts in uptrends while reducing long positions and increasing shorts in downtrends. When analyzing the data, we take into consideration the direction of their position, magnitude of changes, as well as extremes.
Key stats: Net position, one-week change, and where the current position stands relative to the past 52 weeks.
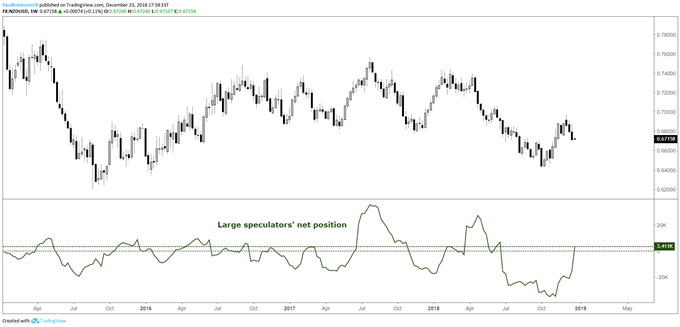
NZD SPECULATORS MADE A STRONG SHIFT INTO LONG TERRITORY
Large speculators turned net-long for the first time since June, with a net purchase of over 18k contracts. It was still a curiously strong move. It was the largest change of hands since selling over 22k contracts back in June when large specs turned net short.
It also comes after a relatively strong up-move and recent reversal. It could turn out to be a poorly timed maneuver, especially if Kiwi starts going the way of its sibling currency, Aussie, in turning lower.
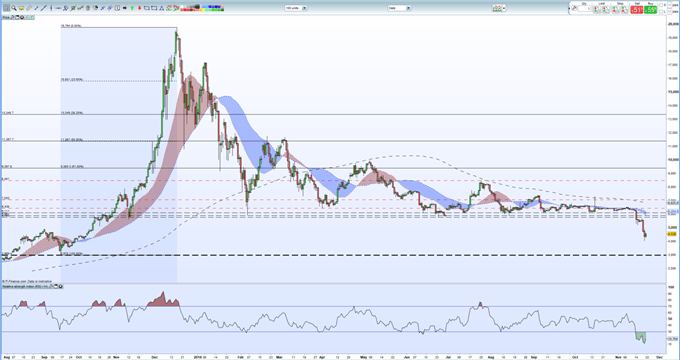
NEW ZEALAND DOLLAR POSITIONING CHART
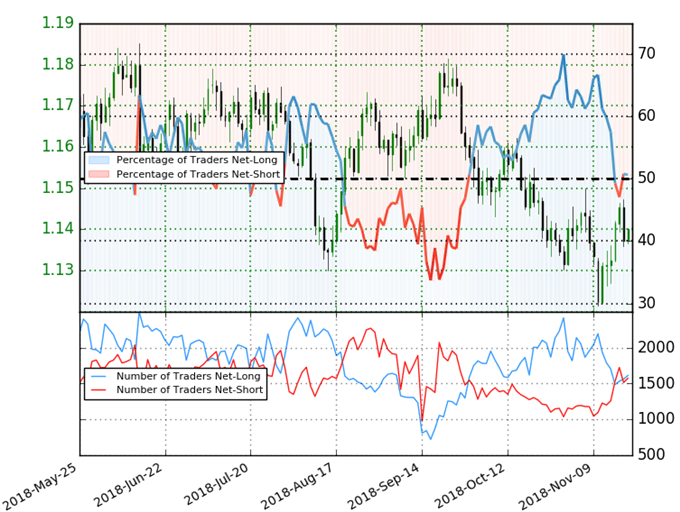
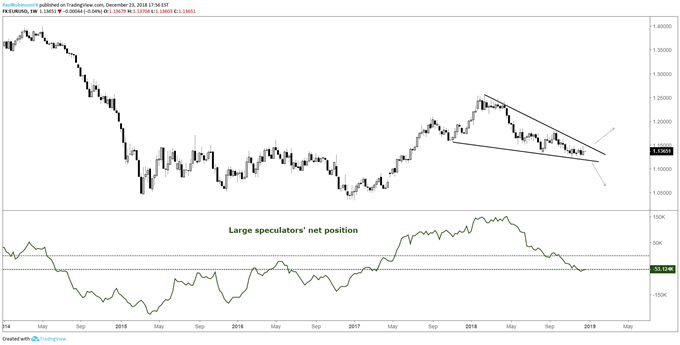
EURO SPECS COVERED FOR SECOND WEEK IN A ROW, BUT REMAIN FIRMLY BEARISH
Large speculators in aggregate bought 3k contracts last week, the second week in a row we saw their short position shrink amidst a choppy trading environment. Large specs have been short since September and remain firmly in the bear camp.
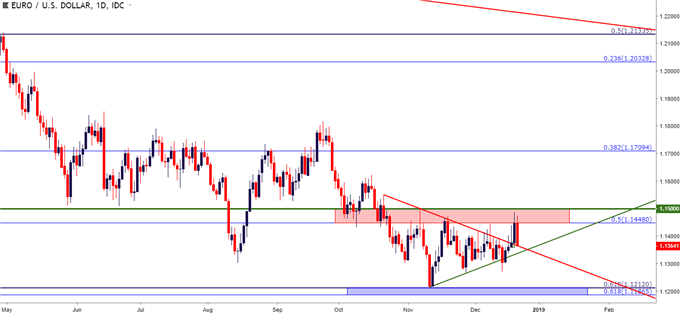
Price action has generally become coiled up throughout the year, which could make for an explosive price move soon. If the generally weak trend since the high of the year continues, look for the -53k contract position to expand as we head into 2019. Conversely, if a strong move develops against the trend it could spark a strong reversal as traders are caught leaning the wrong way. A resolution one way or the other looks to be just around the bend…
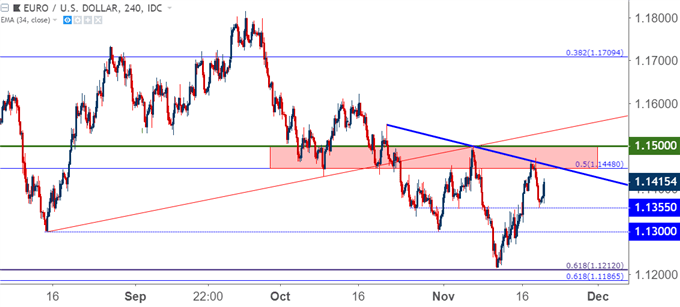
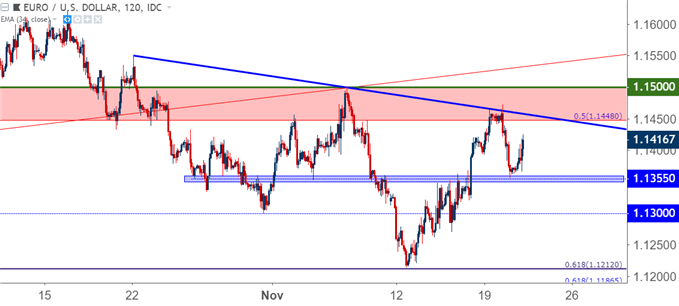
EURO POSITIONING CHART
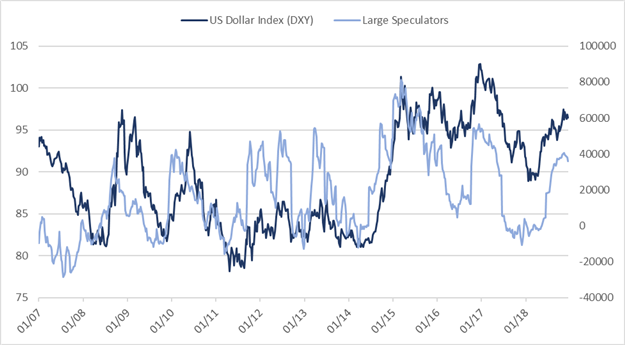
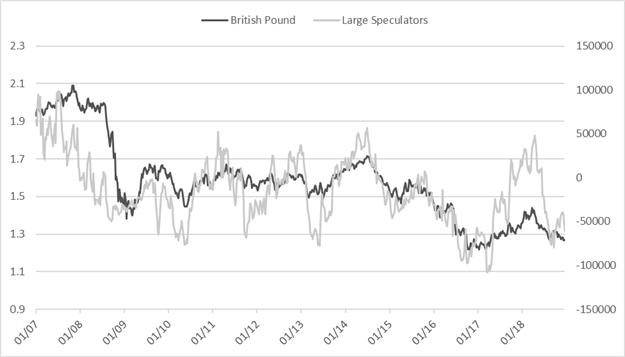
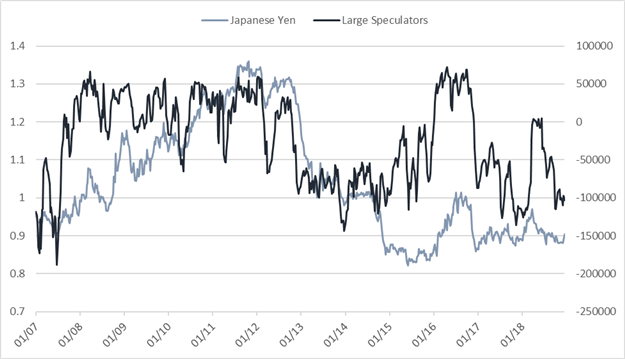
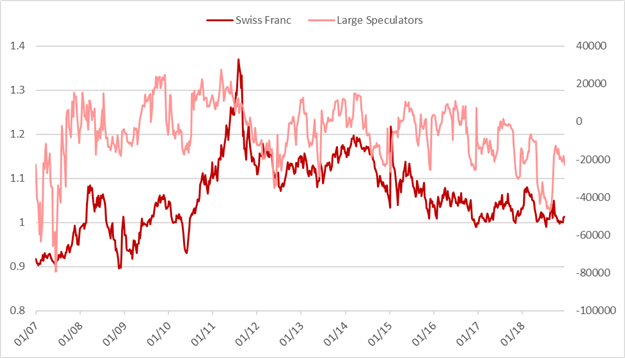
OTHER MARKETS:
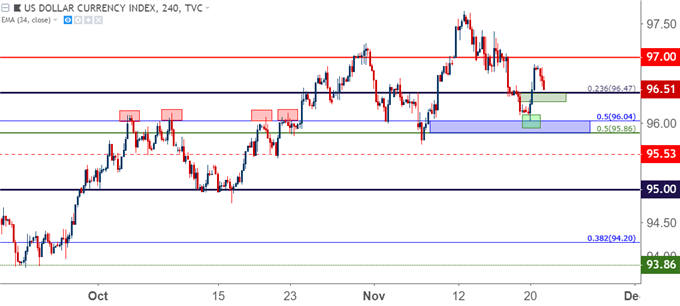
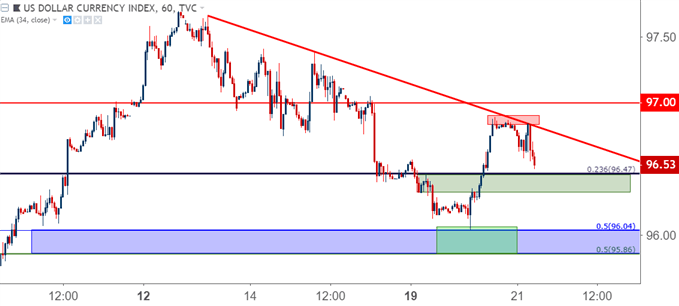
U.S. DOLLAR INDEX
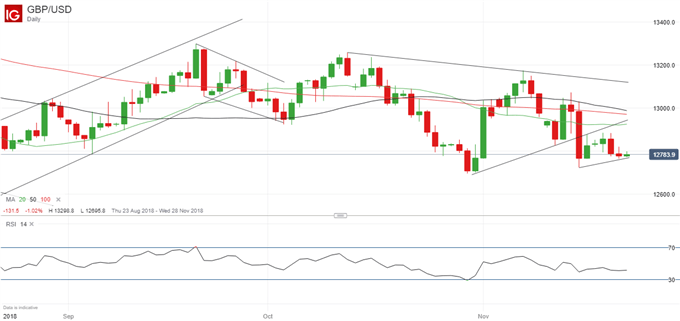
BRITISH POUND
JAPANESE YEN
SWISS FRANC
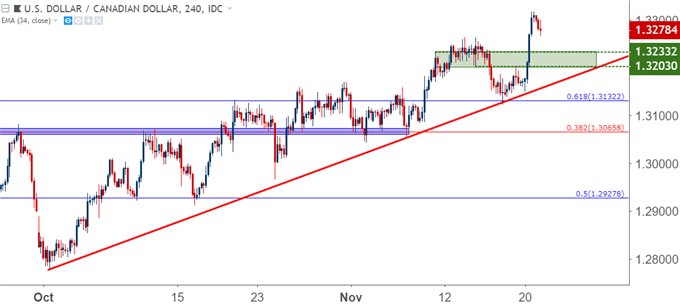
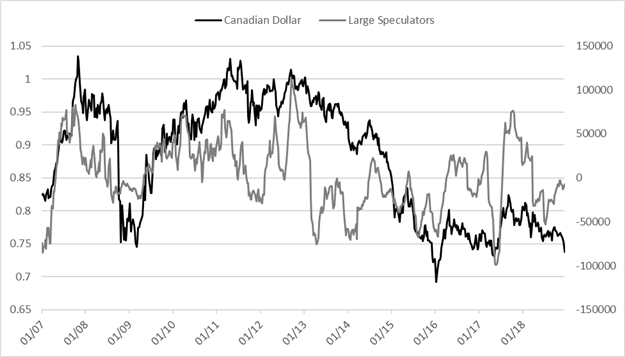
CANADIAN DOLLAR
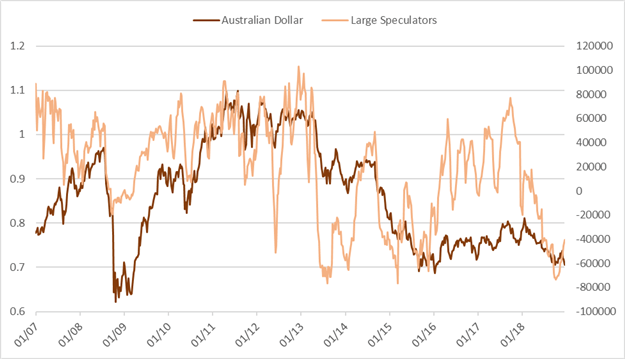
AUSTRALIAN DOLLAR
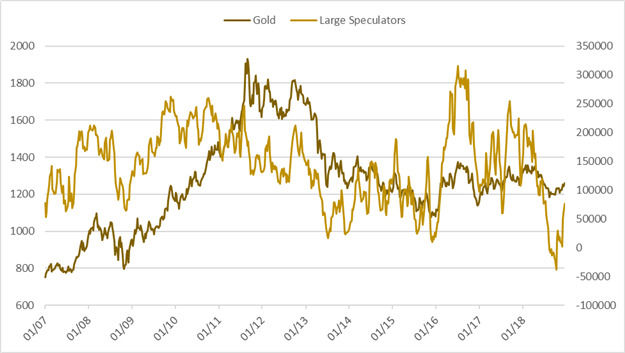
GOLD
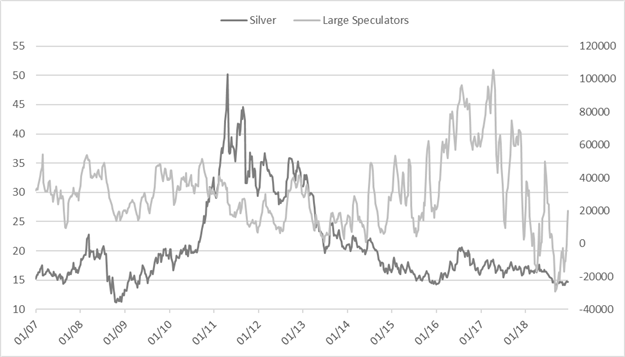
SILVER
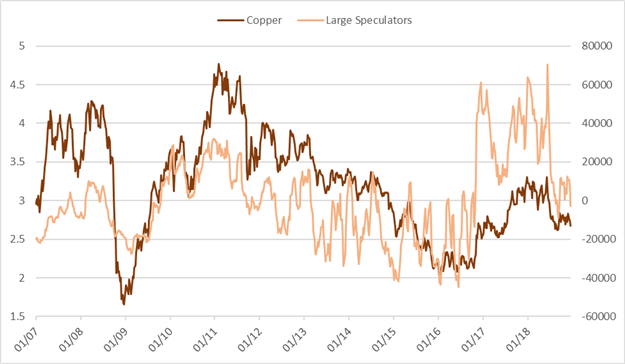
COPPER
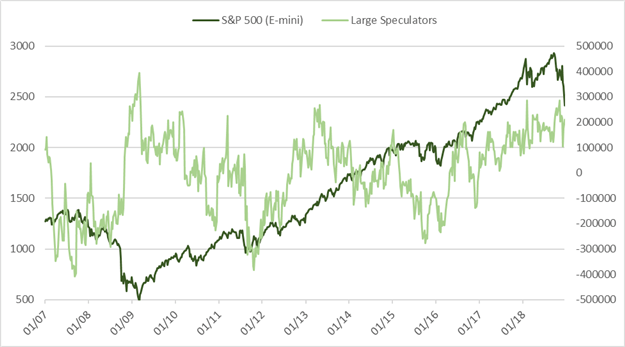
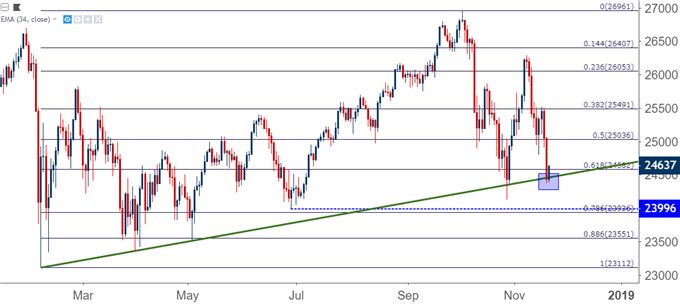
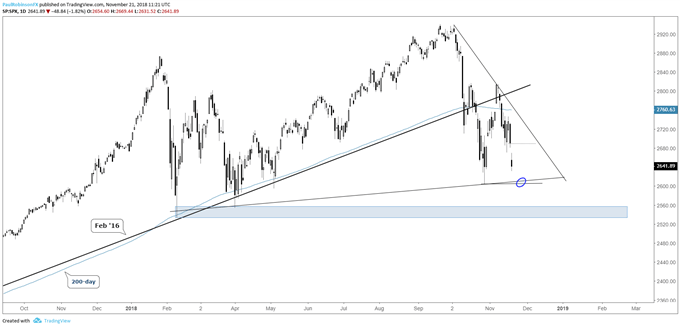
S&P 500 (E-MINI)