Brexit, Euro, GBP – TALKING POINTS
- Euro, GBP brace for Brexit volatility as government flounders
- Bare data docket leaves traders focusing on fundamental risks
- Euro volatility may be curbed by upcoming ECB rate decision
Learn how to use political-risk analysis in your trading strategy!
The British Pound and Euro will likely find themselves being torn by Brexit-related volatility amid a bare data docket. A report by The Telegraph recently stated that UK Prime Minister Boris Johnson is looking into legal ways to circumvent a law that was passed in Congress last week that compels him to request a three-month Brexit extension by October 19 if he is unable to reach a deal by that point.
However, given the state of UK politics, it is difficult to say with confidence that the government has secured a unified position on the matter. 21 conservative lawmakers have been expelled from the party after they supported a bill that rejects a no-deal Brexit outcome. Others have defected or resigned like Pension Secretary Amber Rudd who’s scathing message to the Prime Minister sent out a political shockwave.
EUR/GBP TECHNICAL ANALYSIS
Heading into Sunday’s session, EURGBP gapped lower along with other Euro crosses. A possible reason behind the price move may be due to the expectation that the ECB will deliver aggressive stimualtive policies market participants have been pricing in. These include a rate cut and the reintroduction of QE. However, EUR/GBP’s decline may be reversed if the ECB is not as dovish as investors hoped it would be.
EUR/GBP Gaps Lower
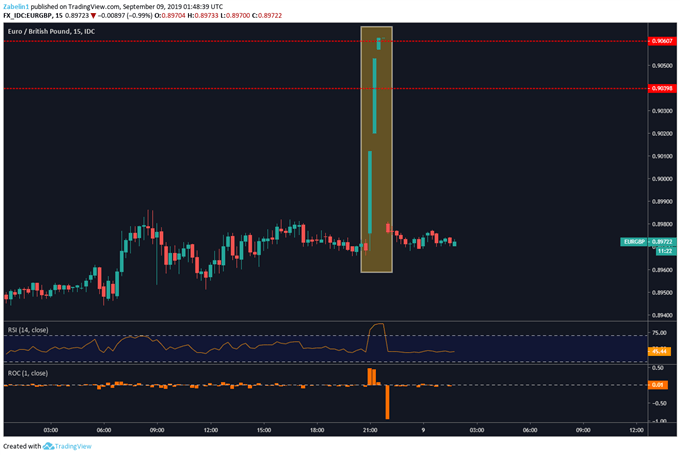
EUR/GBP chart
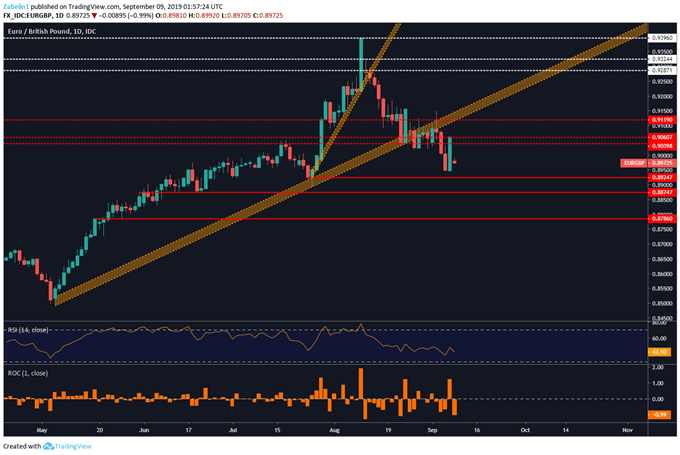
EUR/GBP is now trading below a key support-now-turned resistance level and could stay within a congestive range between 0.8974-0.9039. The pair have already broken through several key support channels and barriers and could be gearing up to clear more if momentum is maintained. However, political volatility from Brexit and the ECB rate decision this week may distort the technical set up.
EUR/GBP – Daily Chart