The Euro tried to reverse on Friday but failed to garner any follow-through, bringing the August low into play. This has the DXY on its way higher, giving dollar longs the benefit of the doubt, overall. AUD/NZDthoroughly tested neckline resistance but was rejected yesterday. This shifts momentum back in-line with the breakdown from earlier this month. Gold finally pulls off resistance, bringing support levels a bit lower into view.
TECHNICAL HIGHLIGHTS:
- US Dollar Index (DXY) treading around resistance
- EUR/USD not showing much life after Friday’s reversal
- AUD/NZD turned down from H&S neckline
- Gold price turning strongly lower from resistance
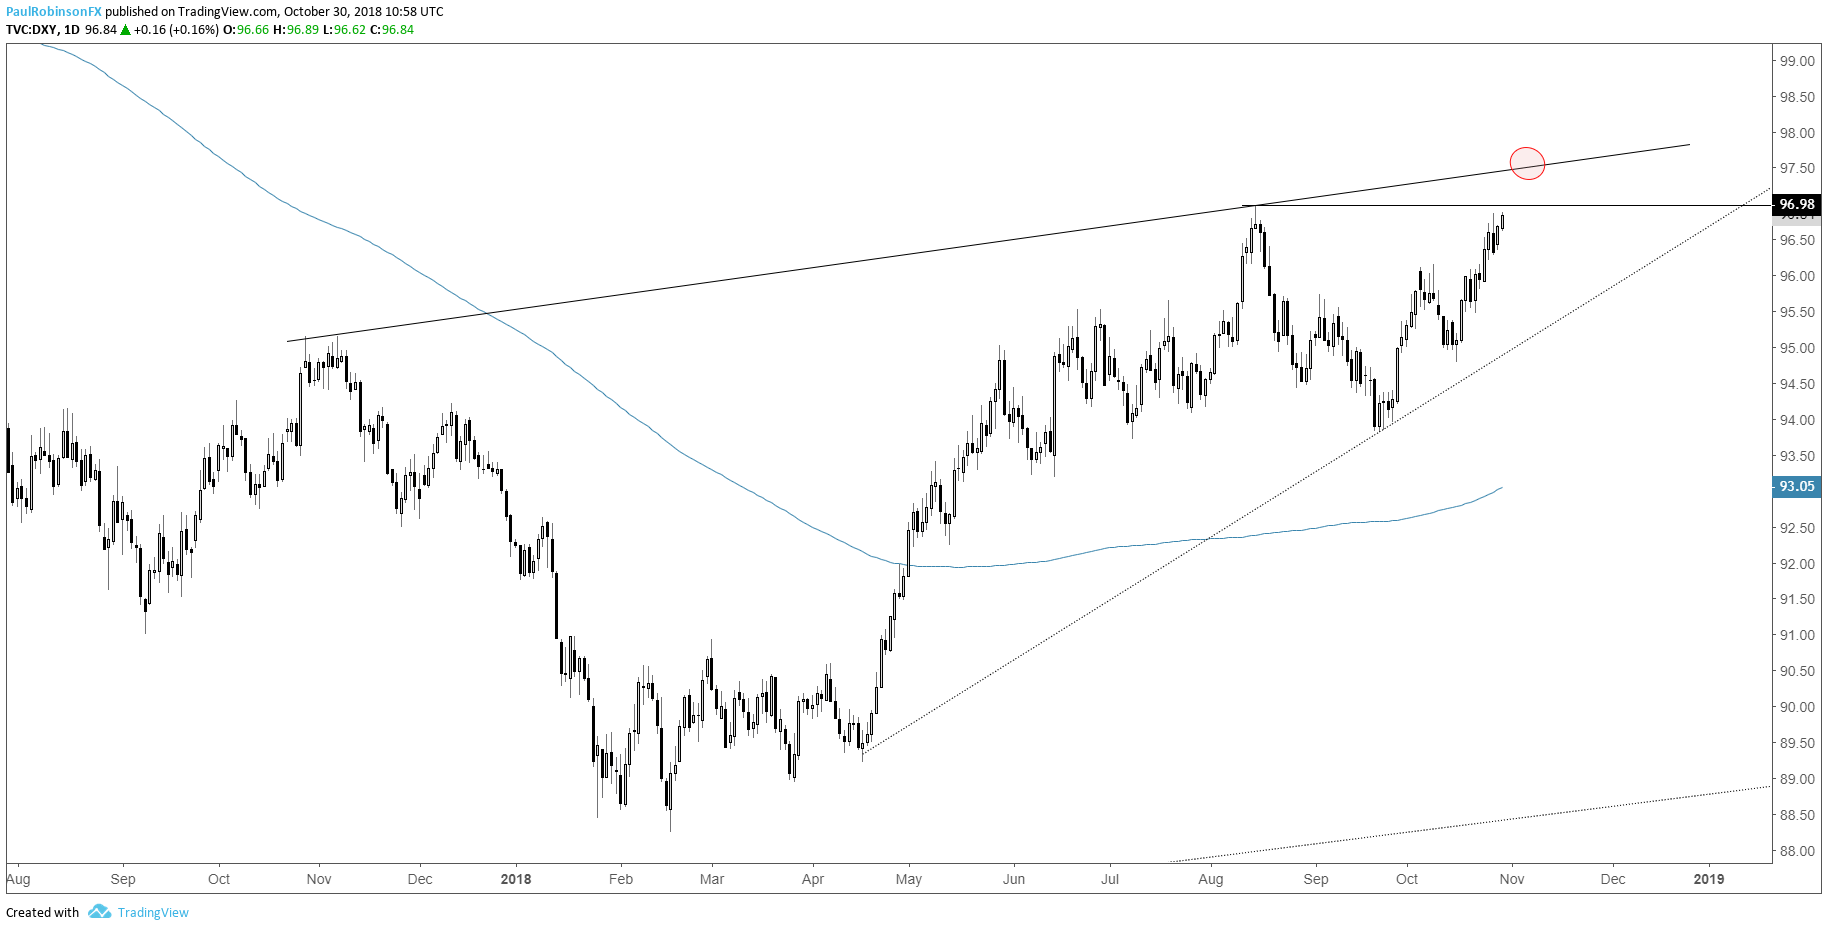
US DOLLAR INDEX (DXY) TREADING AROUND RESISTANCE
The US Dollar Index (DXY) turned hard from resistance on Friday, suggesting perhaps a move lower might be in store. However, trend-line support on the 4-hr kept a bid in and with that we are now seeing an attempt to trade above the August high of 96.98. If it does, the next level (or line in this case) of resistance clocks in at a trend-line crossing over from a year-ago. The benefit of the doubt remains with longs for now.
US DOLLAR INDEX (DXY) DAILY CHART (TRYING TO BREAK OUT)
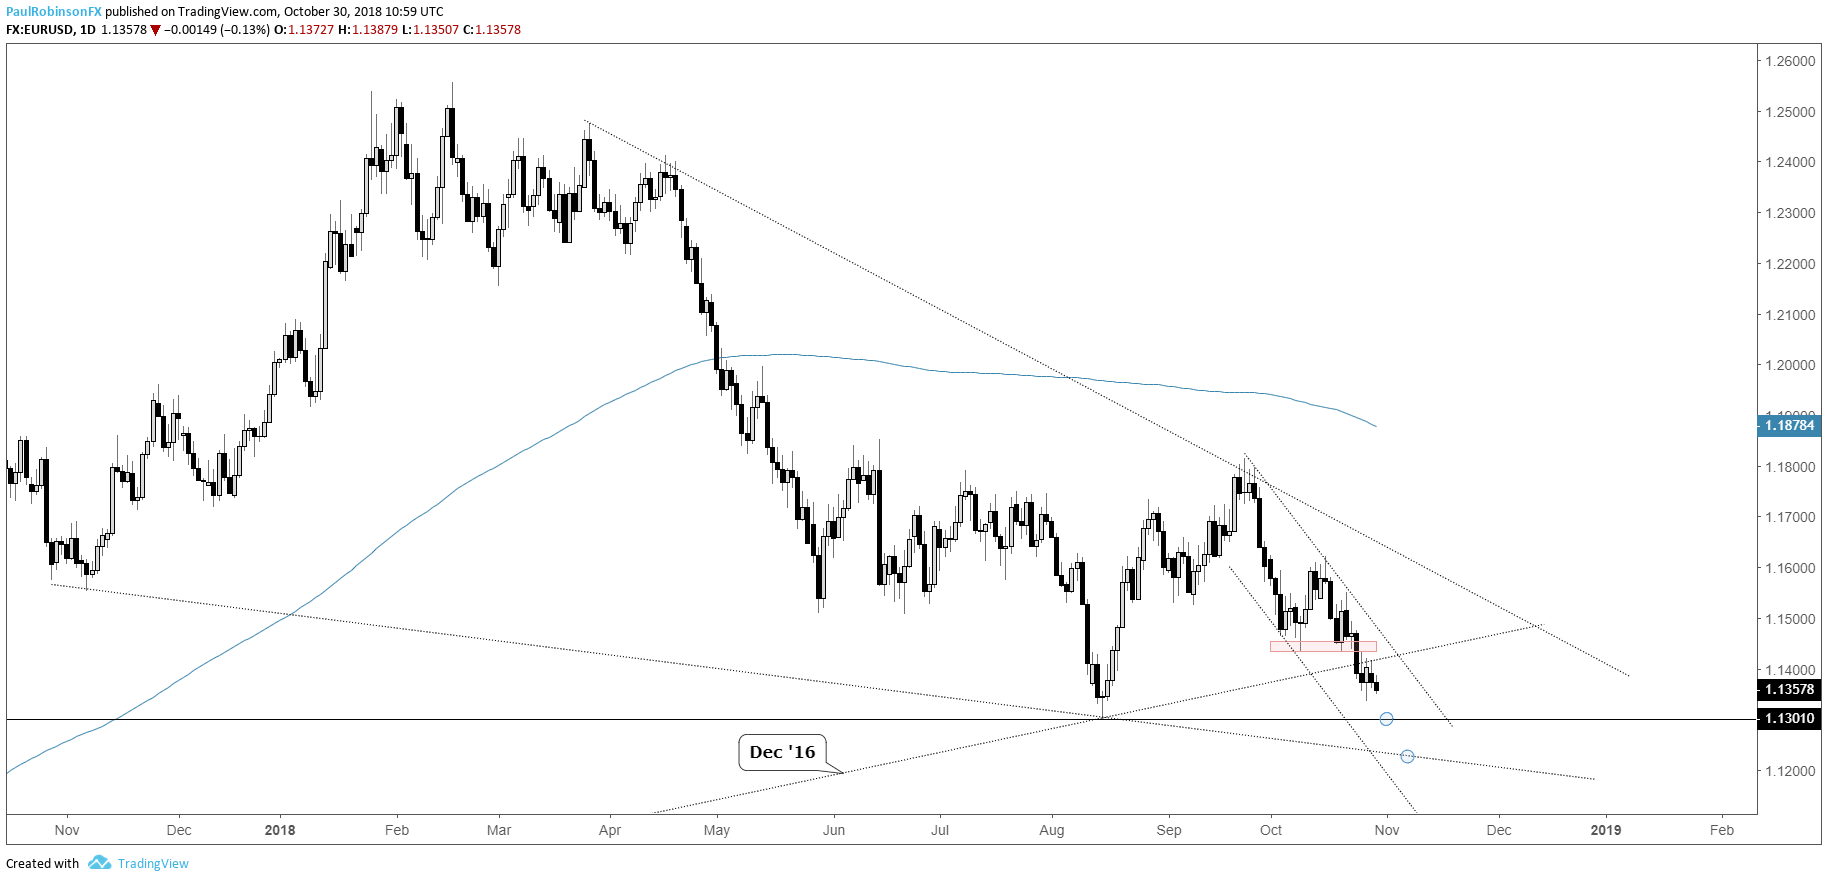
EUR/USD NOT SHOWING MUCH LIFE AFTER FRIDAY’S REVERSAL
The Euro’s reversal on Friday failed to bring with it much more buying interest. The largest driving component of the DXY is now pushing towards the August low at 11301. On a break through 11301 the underside trend-line from November will come into focus in the low-11200s.
EUR/USD DAILY CHART (AUGUST LOW COMING UP)
AUD/NZD TURNED DOWN FROM H&S NECKLINE
The neckline of the head-and-shoulders formation broke during the middle of the month and was thoroughly tested to end last week, start the current one. The turn down yesterday was fairly fierce and seen as likely the worst of the retest. Stay below 10900 and the pattern remains firmly intact for lower prices.
AUD/NZD DAILY CHART (TURNING DOWN FROM NECKLINE)

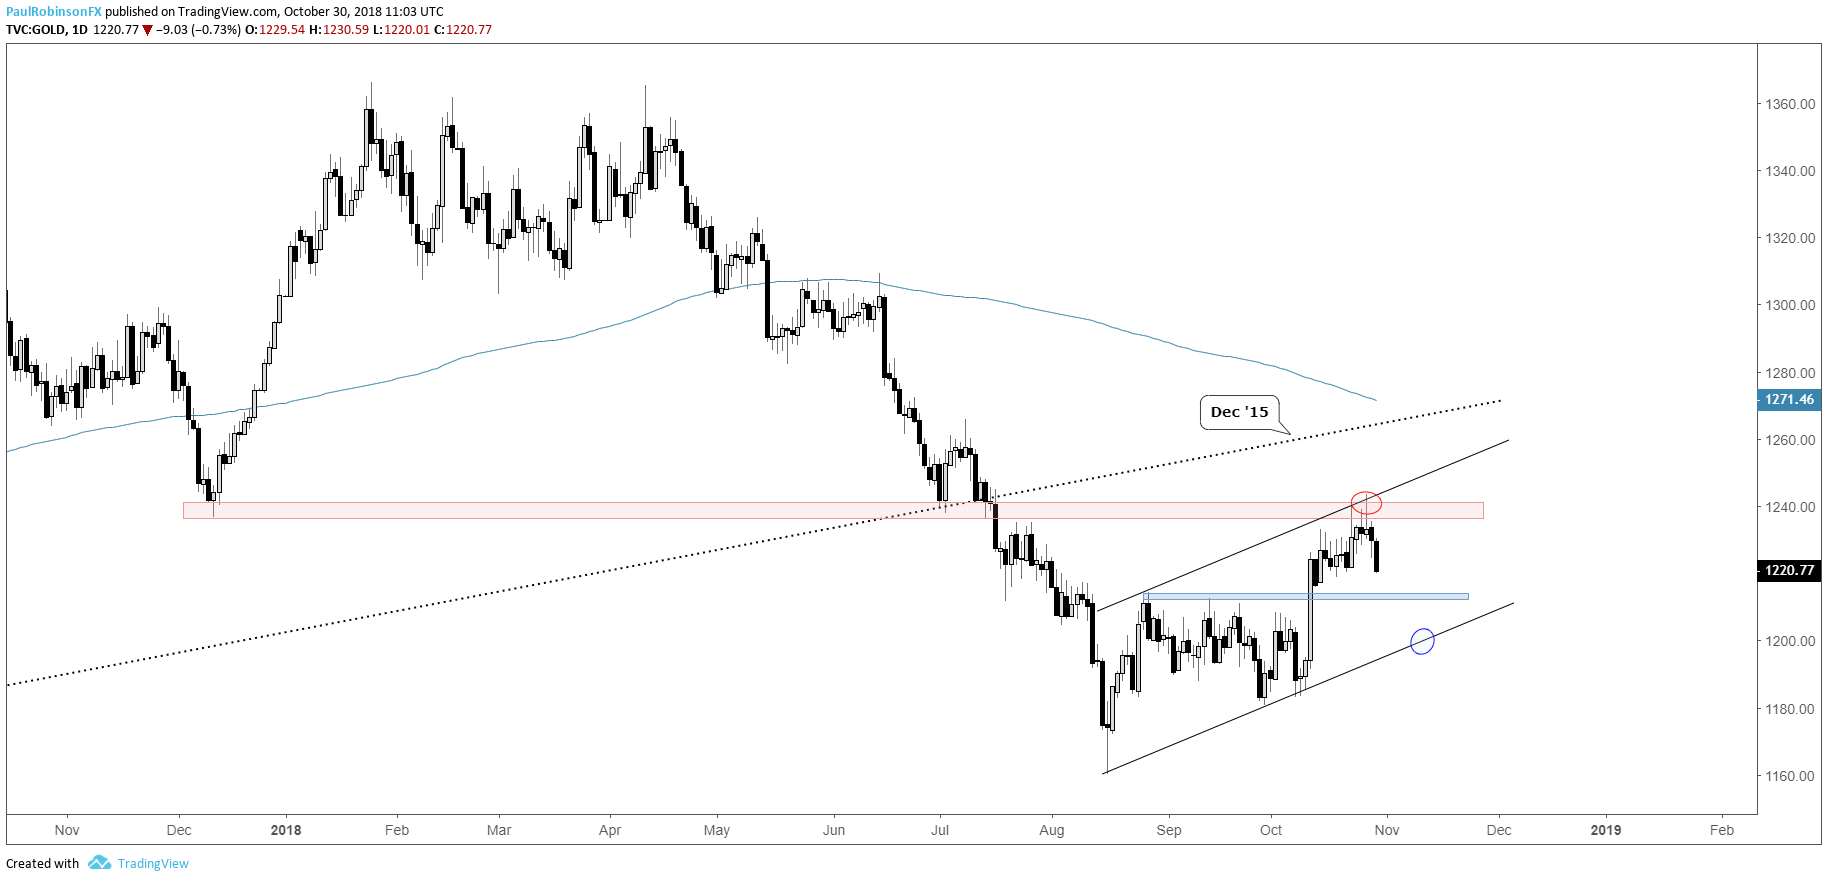
GOLD PRICE TURNING STRONGLY LOWER FROM RESISTANCE
Gold posted a key reversal on Friday after probing a bit further into resistance via lows from the end of 2017 to more recent along with the upper parallel of the channel off the August low. The turn down is seen as bringing into play the 1214/10-area from August/September and possibly the lower parallel if selling picks up momentum.
GOLD DAILY CHART (COMING OFF CONFLUENCE OF RESISTANCE)
No comments:
Post a Comment