This past week the euro tried to make good on a breakdown below important support surrounding 11500, but quickly reversed and recaptured the important threshold. This has focus shifted to the upside. GBP/USDhas been persistently strong as of late and is looking to build on a broader bottoming pattern that could have significantly bullish implications if it can cross a couple of hurdles just ahead. GBP/JPY is forming a triangle around resistance and could soon trade higher. Gold finally showed signs of life and broke free from congestion, the key will be maintaining the breakout in the days ahead.
TECHNICAL HIGHLIGHTS:
- EUR/USD recaptured important support, focus is higher
- GBP/USD forming a broad bottoming formation
- GBP/JPY triangle below resistance could be quality
- Gold price shows life, needs to hold above breakout levels
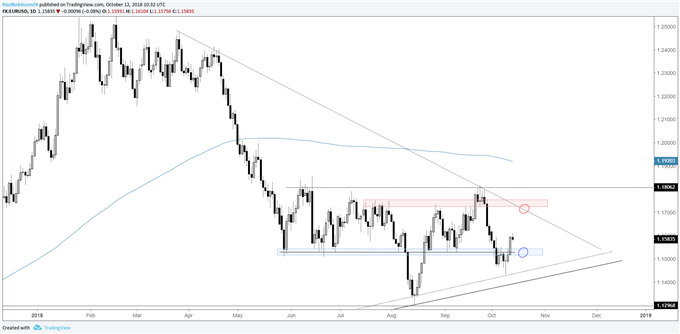
EUR/USD RECAPTURED IMPORTANT SUPPORT, FOCUS IS HIGHER
Early in the week the euro was looking to make good on a breakdown below 11500, but as we noted on Tuesday how much further it could go would depend on how it reacted in the area of 11430/11380 (trend-line support). Right near the top of this zone buyers showed up and helped carve out a key-reversal day. The surge higher yesterday pushed EUR/USD clearly back above 11500, and on that has focus on a trend-line from April and resistance in the 11700s. As long as 11500 holds so will a neutral to bullish bias.
EUR/USD DAILY CHART (BACK ABOVE 11500)
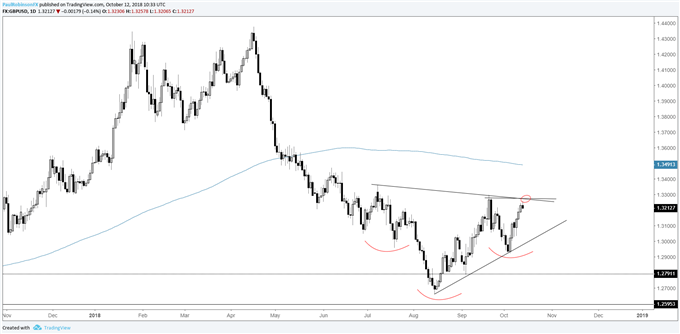
gbP/USD FORMING A BROAD BOTTOMING FORMATION
GBP/USD has been a steady riser the past week-and-a-half, and with that the possibility of a bottoming formation taking on the shape of an inverse head-and-shoulders. Crossing the neckline and 13300 should see cable higher towards the 13500 level in the near-term. Buying into an up-move like this isn’t the most appealing, so a consolidation or pullback following a breakout may be the most prudent approach.
GBP/USD DAILY CHART (BOTTOM FORMATION TO LAUNCH HIGHER?)
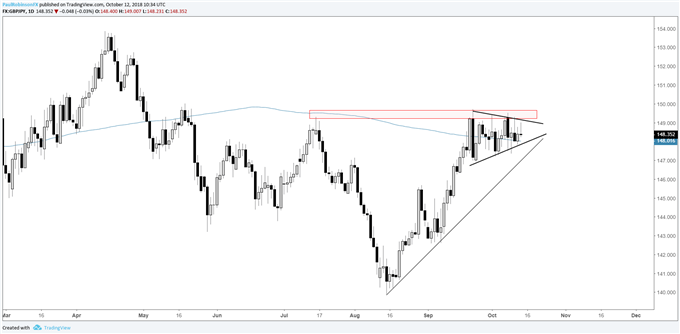
GBP/JPY TRIANGLE BELOW RESISTANCE COULD BE QUALITY
GBP/JPY has been jostling around with little directional cues. But through it all a clear triangle is beginning to emerge right at resistance. The pent-up price action is seen as resolving soon and with a break through resistance a decent burst higher may be in the works. Clearance above 14971 will have all recent resistance cleared.
GBP/JPY DAILY CHART (LOOKING FOR TRIANGLE BREAKOUT ABOVE RESISTANCE)
GOLD PRICE SHOWS LIFE, NEEDS TO HOLD ABOVE BREAKOUT LEVELS
As discussed this morning with regard to gold, it finally broke the choppy range which dominated trade since August. As long as the top of the range around 1214/10 holds then price is skewed towards trading higher.
GOLD DAILY CHART (TOP OF RANGE IS SUPPORT)

No comments:
Post a Comment