GBPUSD TALKING POINTS:
- GBPUSD is softening after a strong four-day push, with resistance showing at the 14.4% retracement of the January bullish trend. Aiding in that pullback is US Dollar strength being driven from today’s release of FOMC meeting minutes from the January rate decision.
- Brexit remains a difficult driver to work with and the prospect of longer-term trend substantiation can remain as a challenge around GBP-pairs in the near-term. But, given the volatility that’s continued to show around the currency, the door can remain open for short-term strategies utilizing support and resistance levels in order to reinforce strong risk-reward ratios.
GBPUSD BACKTRACKS AFTER TESTING FIBONACCI RESISTANCE
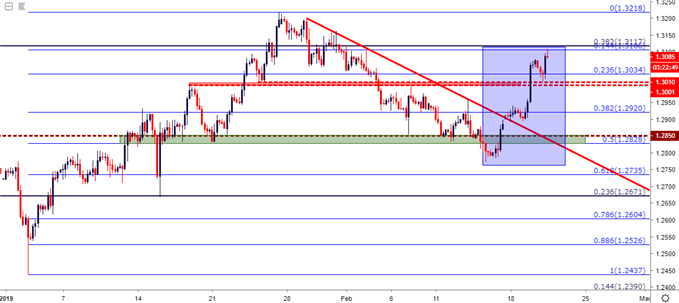
The British Pound is pulling back after testing above the 1.3100 level earlier this morning. This capped a strong topside run that showed up after the print of a fresh low less than a week ago. The month of January brought a stretch of strength into GBPUSD that likely caught many by surprise, especially considering the way that the year started for the pair: GBPUSD put in a rather large drop on January 3rd, slipping below 1.2500 temporarily as bears made a push. But the rest of January was marked by recovery, as GBPUSD climbed back above the 1.3000 psychological level to test above 1.3200.
As looked at last week, prices began soften from that bullish theme in the final week of January. And that pullback ran for more than a couple of weeks as GBPUSD tested below the 50% marker of the January bullish run. But since then, buyers have made a pronounced entrance back into the equation, particularly over the past two days of price action, helping to firm prices back above the 1.3000-handle.
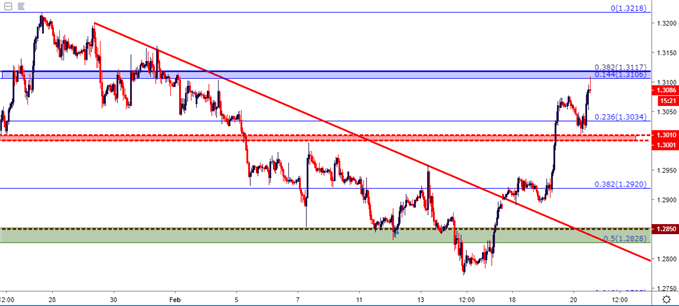
GBPUSD FOUR-HOUR PRICE CHART
At this point, prices have vaulted into another area of potential resistance, as the space between 1.3106-1.3117 has two different Fibonacci levels of interest. The 1.3106 level is the 14.4% retracement of the January bullish move, while 1.3117 is a longer-term level as the 38.2% marker of the ‘Brexit move’ in the pair.
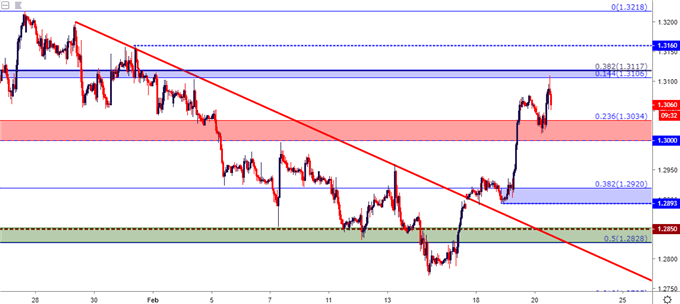
GBPUSD HOURLY PRICE CHART
GBPUSD STRATEGY
As discussed over the past few weeks, traders will likely want to continue to limit strategy around GBP-pairs to shorter-term variants, as the volatile nature of the backdrop around the British Pound can continue to evoke turns in either direction. Short-term strategies utilizing support and resistance levels to reinforce advantageous risk-reward ratios appears to be a prudent way of approaching matters in the near-term.
On the below hourly chart are a number of potential levels on either side of current price. For resistance, the zone that’s eliciting the current reaction remains relevant and that rests from 1.3106-1.3117. A bit higher at 1.3160 is the January 31st swing-high, and above this is the 2019 high at the 1.3218 marker that came into play a few weeks ago. For support, the next area of focus is 1.3000-1.3034, which helped to hold the lows earlier this morning. Below that is a zone that runs from 1.2893-1.2920, which currently marks this week’s swing low; and underneath that area is the same 1.2828-1.2850 area that was looked at last week.
GBPUSD HOURLY PRICE CHART
No comments:
Post a Comment