EURUSD PRICE, ANALYSIS AND CHARTS:
- US dollar bulls continue to push ahead, eyeing fresh one-month high.
- Euro weakness fueled by a constant flow of weak data releases.
EURUSD – NEGATIVE BIAS EXPECTED TO CONTINUE
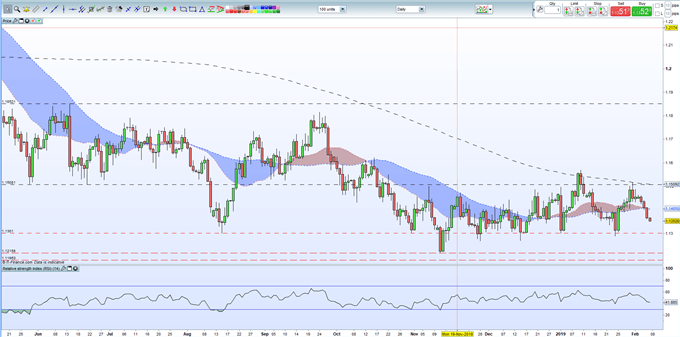
The current strength in the US dollar is hitting EURUSD hard and pushing it lower with seven daily lower highs currently registering on the chart.And further falls may be ahead when the European Commission publish their latest economic forecasts.
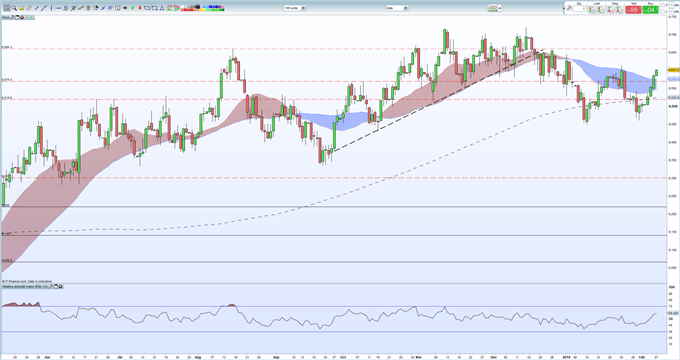
The US dollar continues to push higher and is within sight of a fresh one-month high on little real economic news or data. Treasury yields remain supportive against other major currencies, while the Fed perhaps remains as the only major central bank expected to hike this year. The US dollar basket chart remains positive – above all three moving averages – and a break and close above the January 24 high at 96.15 is seemingly likely. The RSI indicator is currently trading near a two-month high, suggesting the move may be becoming overbought.
US DOLLAR BASKET (DXY) DAILY PRICE CHART (MAY 2018 – FEBRUARY 7, 2019)
The latest in a long-line of weak EU data releases saw German industrial production fall further, missing already low expectations. Today’s release follows Wednesday’s German factory order numbers which fell sharply to -7% y/y, highlighting the growth problems in Euro-Zone. Later today the European Commission will release its latest Economic Forecasts and growth expectations will be cut from the Autumn release. The last report saw growth expectations in the Euro-Zone cut to 1.9% for 2019 and 1.7% for 2020, numbers that now look unlikely to be reached.
EURUSD retains a negative bias as it falls back towards the 1.1300 level. This level continues to provide an area of support, but if broken then the November low of 1.1215 comes quickly into play, ahead of 61.8% Fibonacci retracement at 1.1187.
EURUSD DAILY PRICE CHART (MAY 2018 – FEBRUARY 7, 2019)
No comments:
Post a Comment