GOLD & SILVER PRICE TECHNICAL OUTLOOK:
- Gold momentum stalling at long-term resistance
- Silver overbought and in need of a correction
GOLD MOMENTUM STALLING AT LONG-TERM RESISTANCE
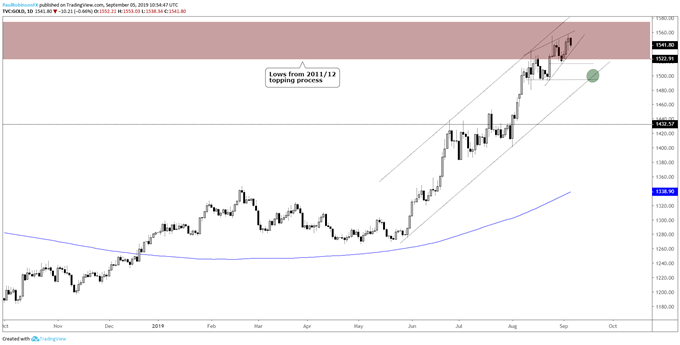
During the first half of last month gold extended into the long-term resistance zone (1522/75) created during the 2011/12 topping process. Since then it has struggled to climb much higher in a sustainable manner. This is anticipated to remain the case in the near-term, with rallies as seen as likely to continuing to fade.
An actual pullback would be a good thing for not only alleviating overbought conditions, but also allowing would-be dip-buyers an opportunity to enter at better prices. Horizontal movement, or a 'time correction', would also be a bullish alternative, but will need, well, time for this to run its course.
From a short-term tactical standpoint, shorts aren’t yet appealing despite overbought conditions into resistance. The reason being is any correction which unfolds may be a bit of a grind sideways to lower as often times corrections tend to unfold in this manner in strong trends.
The first spot to watch as support is the lower parallel rising up from May. Should that fail to hold as support near 1500, then a larger correction towards the mid-1400s may develop. Even if gold falls that far, it wouldn’t do any real damage the move higher over the past year.
GOLD PRICE DAILY CHART (MOMENTUM STALLING AT LONG-TERM RESISTANCE)
Gold Price Chart
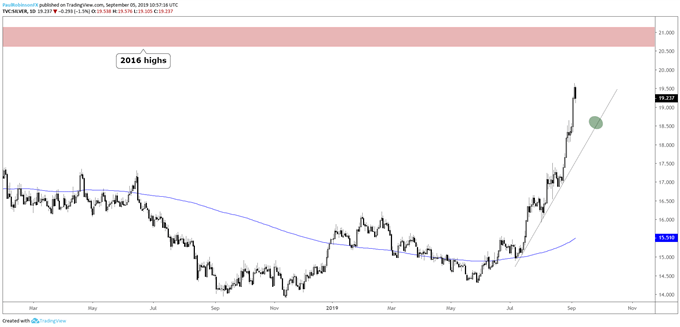
SILVER DAILY CHART (HAS SHORT AND LONG-TERM SUPPORT LINES)
Silver has gone parabolic as of late, making up lost ground compared to gold in recent years. This has led to overbought, overly bullish conditions. There aren’t any great price levels as resistance until you get up to around 20.70/21+, but this doesn’t mean it won’t correct ahead of those levels.
Tactically, shorting here doesn’t hold much appeal, but neither does entering fresh longs. Sort of stuck in a ‘too high to buy, too strong to short’ phase at the moment.
SILVER DAILY CHART (VERY EXTENDED)
No comments:
Post a Comment