DAX 30 TECHNICAL HIGHLIGHTS
- DAX again testing big trend-line support from 2011
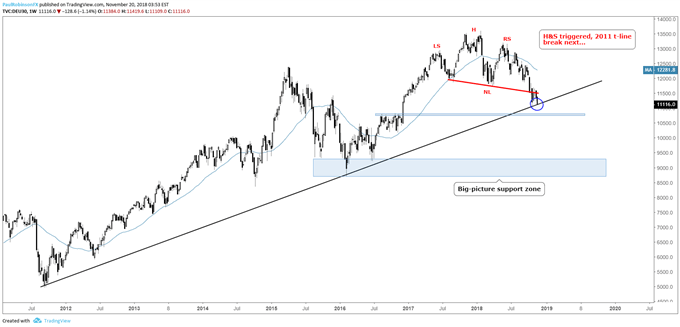
- 17-month head-and-shoulders pattern to keep pressure on
- If the 2011 trend-line breaks, short-term level of support near 10800
DAX AGAIN TESTING BIG TREND-LINE SUPPORT FROM 2011
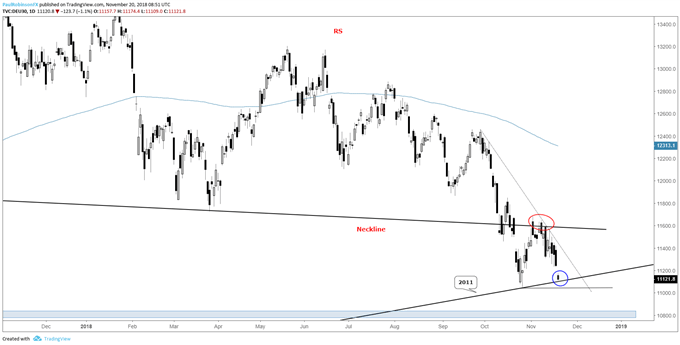
In last week’s DAX commentary, the focus was on big resistance around the neckline of the broad head-and-shoulders pattern, and how if that couldn’t be recaptured then the 2011 trend-line was likely to come back into play.
With global equity markets continuing to sag and the leading U.S. markets also failing to rebound, it looks likely the 2011 trend-line won’t hold much longer. It’s a very important line as it is effectively the last line of major support until lows seen in 2016 in the 9300/8700-area.
Trading down to those levels won’t happen in a straight line, though. On a break of trend-line support and last month’s low at 11050 there is good support down around 10800. The area surrounding this level, give or take 50 points, was created during a consolidation during 2016. It could be enough to put a bounce in, but not viewed as enough to cement a floor.
However, before becoming overly bearish it is important to wait on the 2011 trend-line to break as it is still support until it’s not. A bounce off the line back towards the neckline could develop, in which case traders may then be presented with another opportunity to sell the recently solidified neckline.
DAX DAILY CHART (2011 T-LINE SUPPORT)
DAX WEEKLY CHART (HEAD-AND-SHOULDERS)
No comments:
Post a Comment